
- Solana’s price action has seen a strong recovery from the key support level of $179.66, a point well-aligned with the 61.8% Fibonacci retracement zone
- Solana’s technical and fundamental indicators alluded to a promising bullish rally
Solana (SOL) has been grabbing the attention of traders with its remarkable V-shaped recovery in recent weeks. Its recent price action demonstrated resilience, with critical levels of support and potential bullish targets aligning with technical indicators.
Key support and Fibonacci Retracement levels
Solana’s price action has seen a strong recovery from its key support level of $179.66, a point well-aligned with the 61.8% Fibonacci retracement zone – A critical area for identifying trend reversals.
Historically, this retracement level often acts as a magnet for buyers when bearish pressure begins to fade.
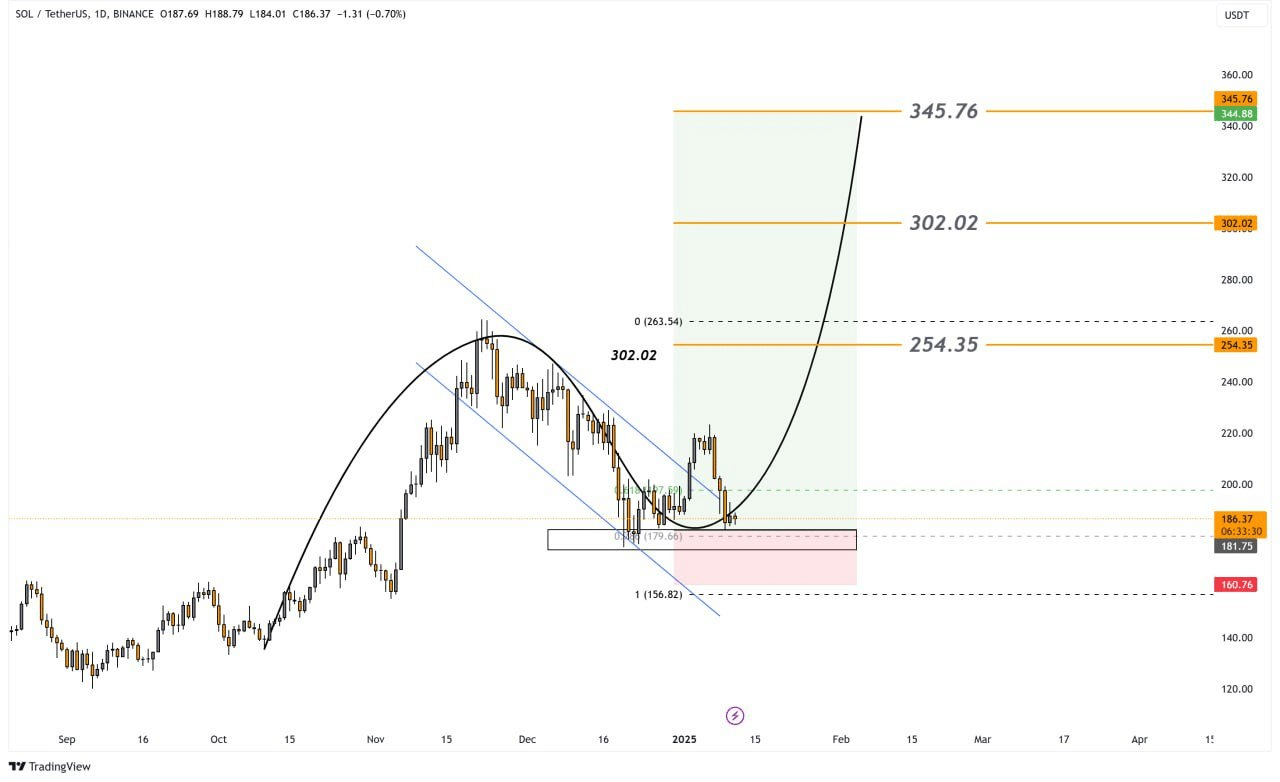
Source: SOL/USD, TradingView
The altcoin’s recent bounce from this level not only validates the support zone, but also positions Solana for significant upward movement towards the bullish targets at $254.35, $302.02, and $345.76 – In alignment with the Fibonacci extensions.
Looking at Solana’s overall market structure, the presence of higher lows following the recovery suggests renewed buyer interest. This seemed to point to potential momentum for a breakout, if the current trajectory holds.
Therefore, SOL may hold the $179.66 level as support, as a break below could invalidate this bullish setup. If market sentiment remains favorable, Solana could move towards its first target of $254.35 within the coming weeks.
MVRV Ratio analysis
At the time of writing, Solana’s MVRV ratio seemed to point to a recovery phase, suggesting that most investors who entered during prior accumulation phases are now either at break-even or slightly in profit.
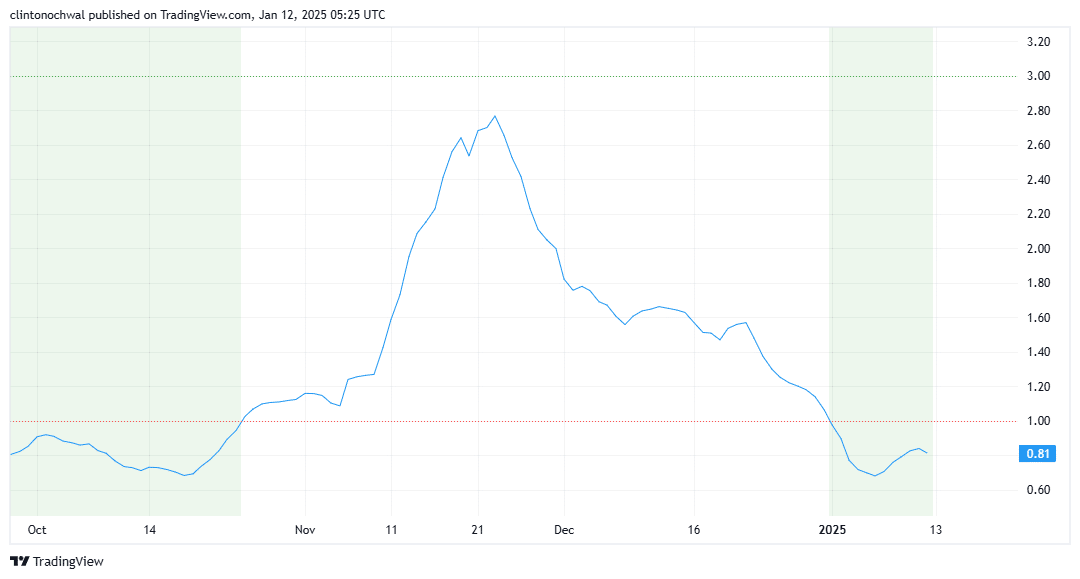
Source: TradingView
Recent data also saw Solana’s MVRV ratio climbing steadily, hovering near a neutral zone that reflects neither extreme undervaluation nor overvaluation. This means that new buyers are entering the market, bolstered by optimism following the recovery from the $179.66 support level.
If the ratio continues to climb, it would signal greater confidence in the asset’s momentum, potentially aligning with the bullish price targets identified in the Fibonacci analysis.
However, a sudden spike in the MVRV ratio towards overbought zones could indicate the need for caution, as profit-taking behavior often follows such peaks. A sustained MVRV in a healthy range between 1.0 and 2.5 would signal a continuation of the bullish rally.
RSI Analysis
The Relative Strength Index (RSI) is another critical indicator supporting the bullish narrative for Solana.
Recent RSI readings suggested that the asset is currently in a neutral-to-bullish zone, with values trending around 55–60. This range indicated that Solana has not yet reached overbought conditions, leaving room for further movement north.
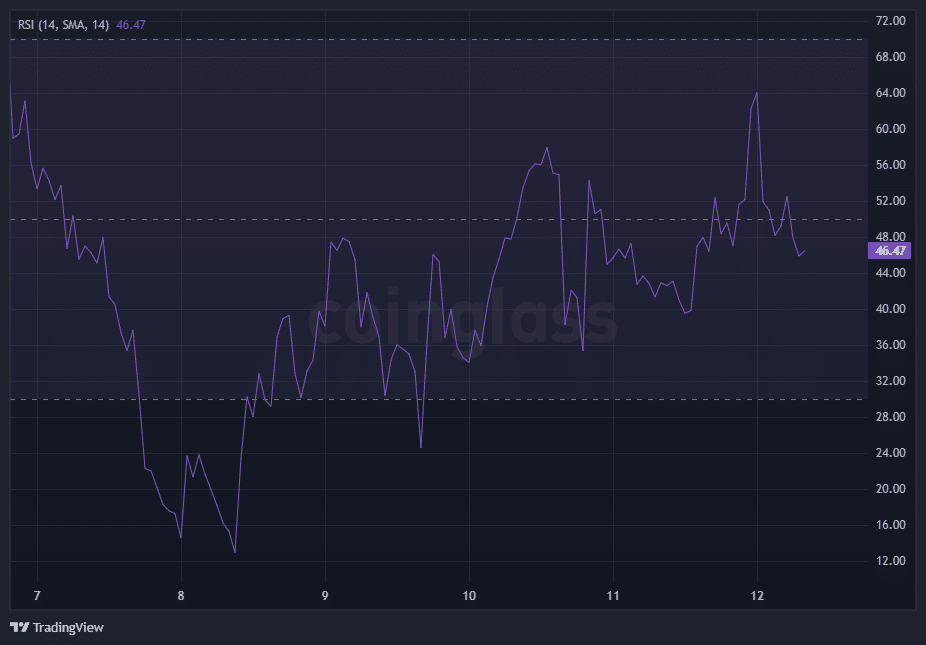
Source: TradingView
In previous rallies, Solana’s RSI has consistently peaked near 70–75 before experiencing pullbacks. This means that the current setup offers ample room for buyers to push the price higher, without triggering a reversal due to overbought conditions.
Solana’s technical and fundamental indicators suggest a promising bullish rally, with clear levels to watch in the coming weeks. The combination of support at $179.66, Fibonacci retracement levels, a rising MVRV Ratio, and a neutral-to-bullish RSI all aligned to create a robust case for further price appreciation.