
After reaching a new all-time high (ATH) of over $108,000 in December 2024, Bitcoin (BTC) has declined more than 15%, currently trading in the low $90,000 range. While bulls fear a further drawdown to $85,000, some analysts remain optimistic, suggesting that the premier cryptocurrency could rebound and potentially top out in the summer of 2025.
Bitcoin To Top In Summer 2025?
According to crypto analyst Dave The Wave, BTC may peak in the summer of 2025, around the middle of the year. The analyst highlighted that Bitcoin’s price trajectory is likely to continue appreciating, as indicated by the 52-week simple moving average (SMA).
Related Reading
Dave the Wave emphasized Bitcoin’s historical adherence to the logarithmic growth curve (LGC), a model that has successfully outlined BTC’s price movements over time. Notably, BTC tends to reach its peak when the 52-week SMA touches the midpoint of the LGC channel. The analyst explained:
The suggestion of a mid year btc peak here: price has previously peaked when the one year moving average hits the midway mark of the LGC channel.
For the uninitiated, the Bitcoin LGC is a model that tracks the cryptocurrency’s price over time on a logarithmic scale, smoothing out its extreme volatility to highlight long-term trends. It uses upper and lower bounds to indicate potential support and resistance levels, helping analysts predict future price movements within a broader growth trajectory.
The following chart illustrates how BTC prices have historically peaked a few weeks or months before or after the 52-week SMA intersects the middle line of the LGC channel. For instance, BTC’s $69,000 ATH in November 2021 occurred months after the 52-week SMA signaled the potential peak in May of the same year.
Based on this trend, Bitcoin could peak within a few months before or after the 52-week SMA crosses the LGC midpoint, which is currently projected to occur in July 2025. This prediction aligns with other forecasts that see BTC reaching $200,000 by mid-2025.
Meanwhile, crypto analyst Bitcoin Munger has pointed to the substantial buy walls between the $85,000 and $92,000 price levels on Binance’s order books. The analyst expressed confidence that “$110,000 is coming either way,” regardless of whether BTC briefly dips into the mid-$80,000 range.
Is The BTC Price Correction Nearing Its End?
Crypto trader Rekt Capital believes Bitcoin may be nearing the end of its current price correction, which typically lasts 2–4 weeks. In an X post, the trader noted that since this correction is now in its fourth week, a rebound could be imminent.
Related Reading
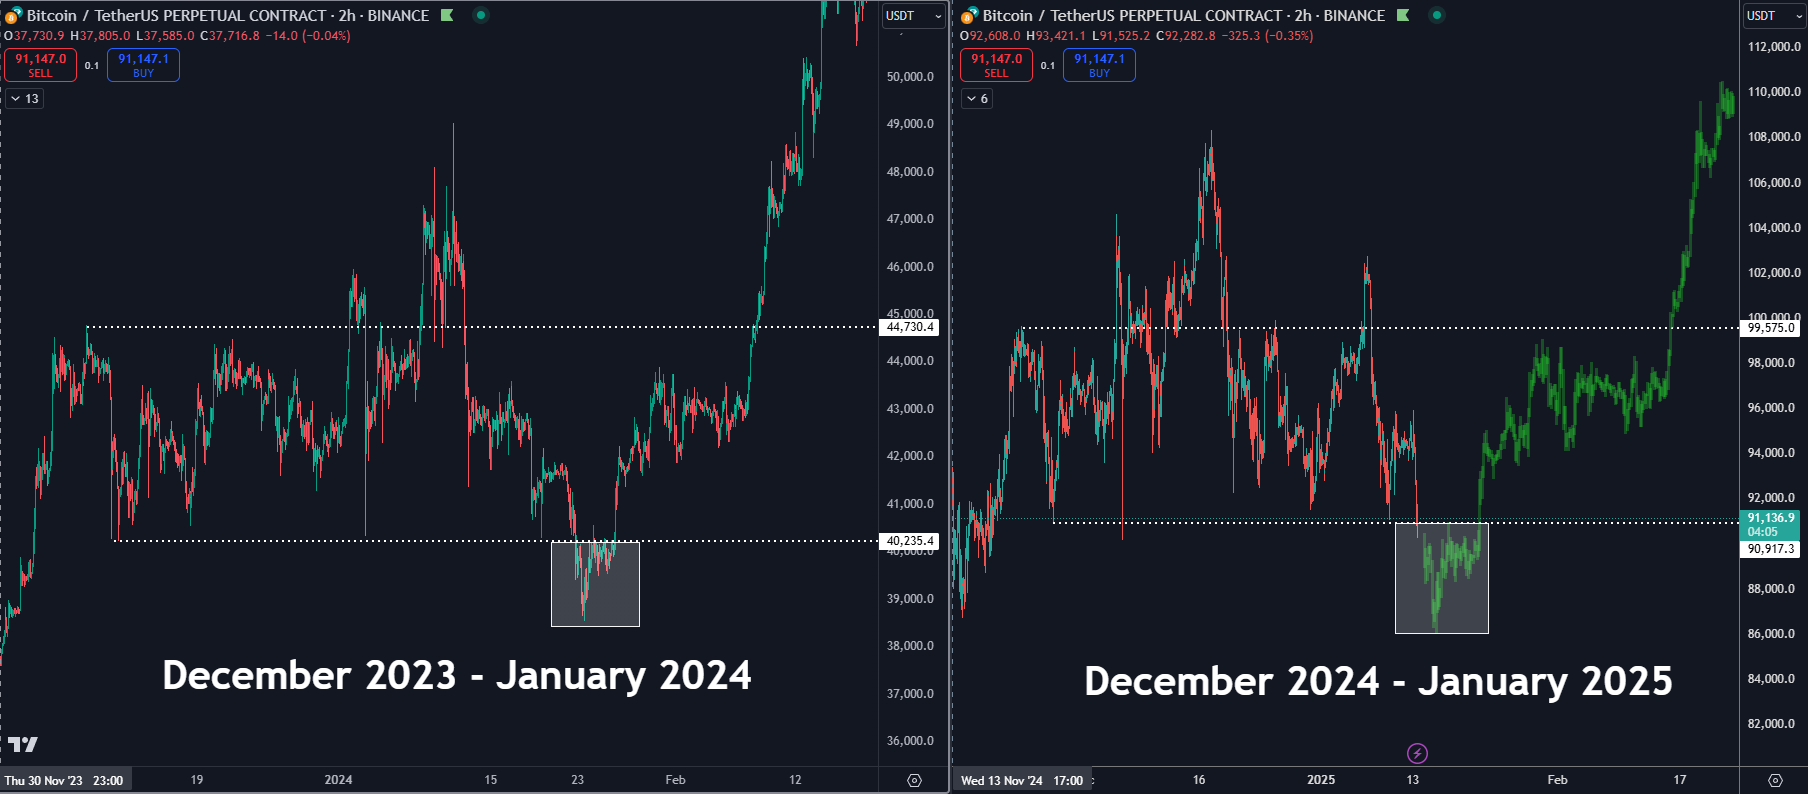
Similarly, crypto investor Daan Crypto Trades compared the current BTC price action to the December 2023–January 2024 period. Using the same price fractal, Daan predicts that BTC could find support around $86,000 before recovering its losses and surging to a new ATH of approximately $110,000.
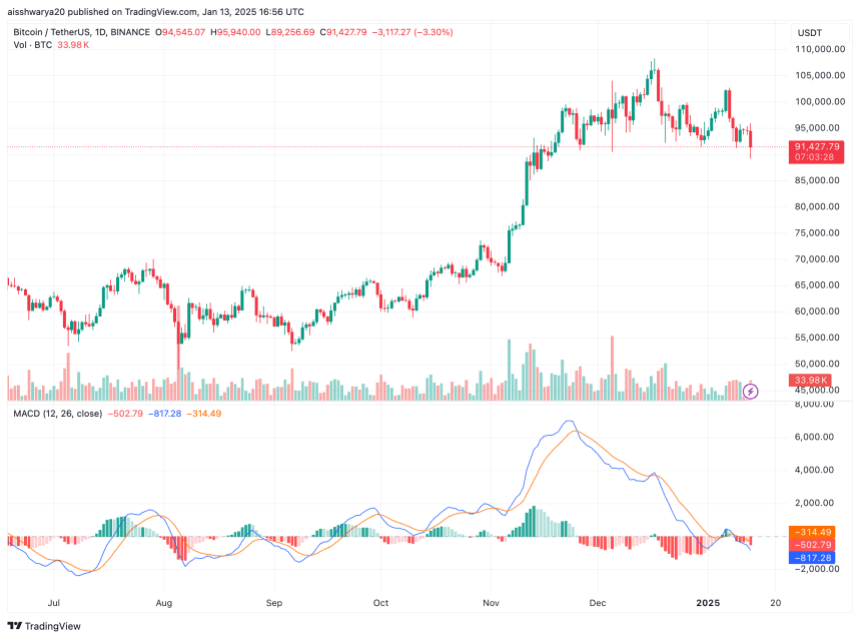
That said, there are still concerns about a potential bearish head-and-shoulder pattern forming on the BTC chart, which may push its price all the way down to $80,000. At press time, BTC trades at $91,427, down 3.7% in the past 24 hours.
Featured image from Unsplash, Charts from X and TradingView.com