
- DOGE’s 50-day MA at $0.37128 meets 0.236 Fib level at $0.36689 – key confluence zone could spark the next major move.
- Daily active addresses show a 1.55 million peak in November, current stability suggests the smart money accumulation phase.
Dogecoin[DOGE] is gaining attention as it nears key resistance levels. It was trading at $0.37076, at press time, with bulls attempting to clear significant resistance.
Strong on-chain activity and building price momentum have many investors speculating about a breakout. The popular meme token’s price action and on-chain metrics suggest a complex setup that could determine its next major move.
Key levels DOGE must break
Dogecoin’s price has been trading near a significant resistance zone at $0.09, which has historically acted as a barrier.
The 50-day Moving Average(MA) at $0.37128 currently acts as dynamic resistance, while the 200-day MA at $0.20570 provides long-term support, indicating a strong overall uptrend despite recent consolidation.
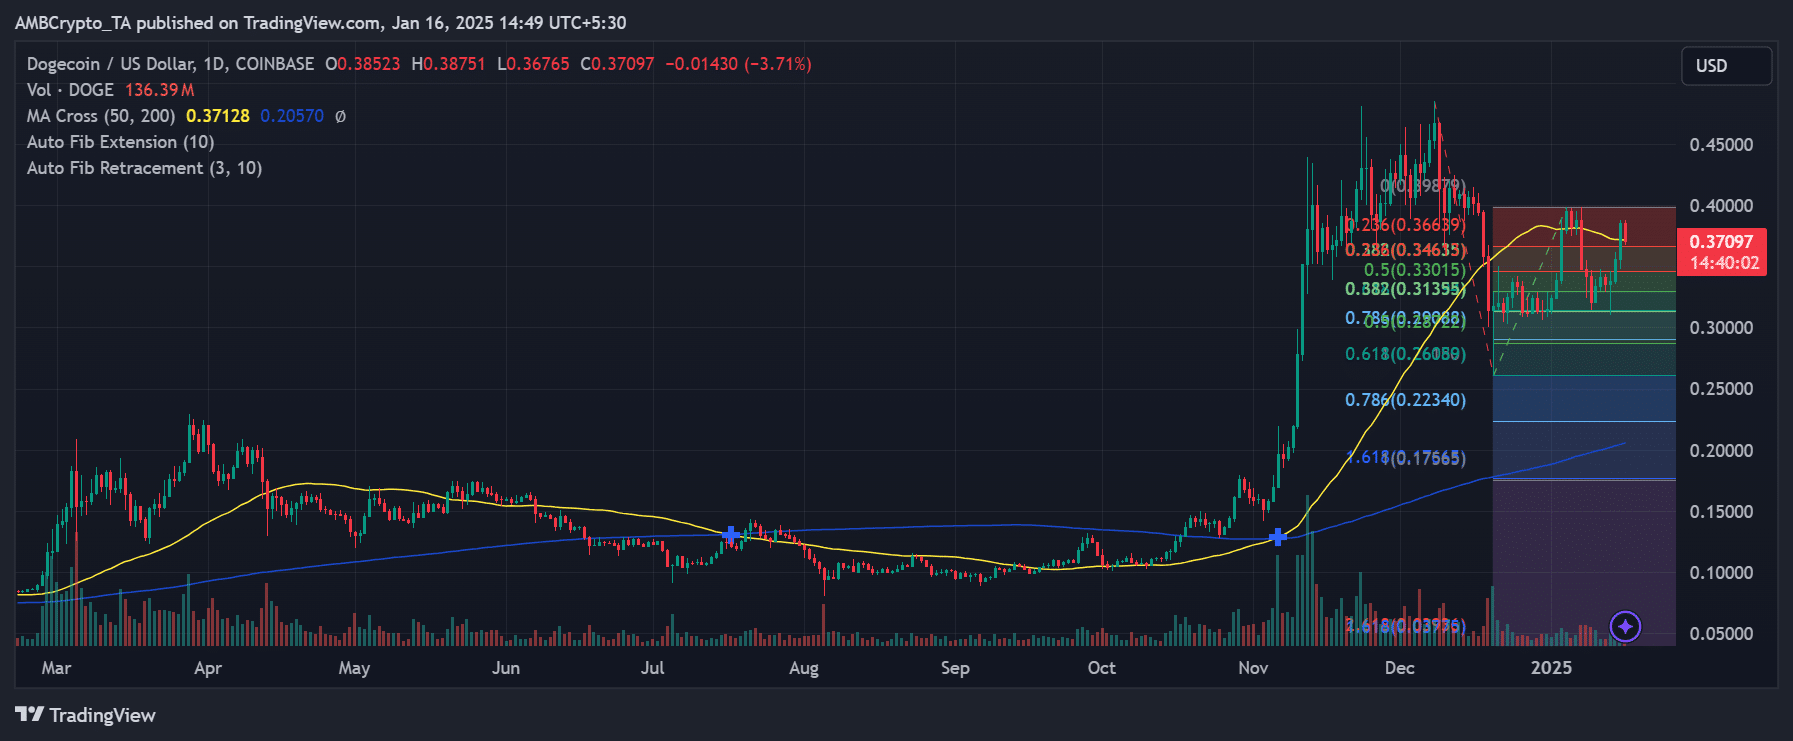
Source: TradingView
DOGE’s price structure reveals critical resistance at the 0.236 Fibonacci level ($0.36689), with the next major hurdle at $0.39879 (0.0 Fib level). It represents the 61.8% and 78.6% levels of its previous price swing.
A clean break above these levels could set DOGE on a path toward the next psychological barrier.
Momentum indicators signal potential energy build-up
The Directional Movement Index (DMI) readings of 18.0543/22.8632/20.5726 suggest a neutral stance, while the Stochastic RSI at 65.95/53.34 indicates room for upside before overbought conditions.
This technical setup implies potential energy building for the next significant move, with key resistance at $0.40000 serving as the primary target.
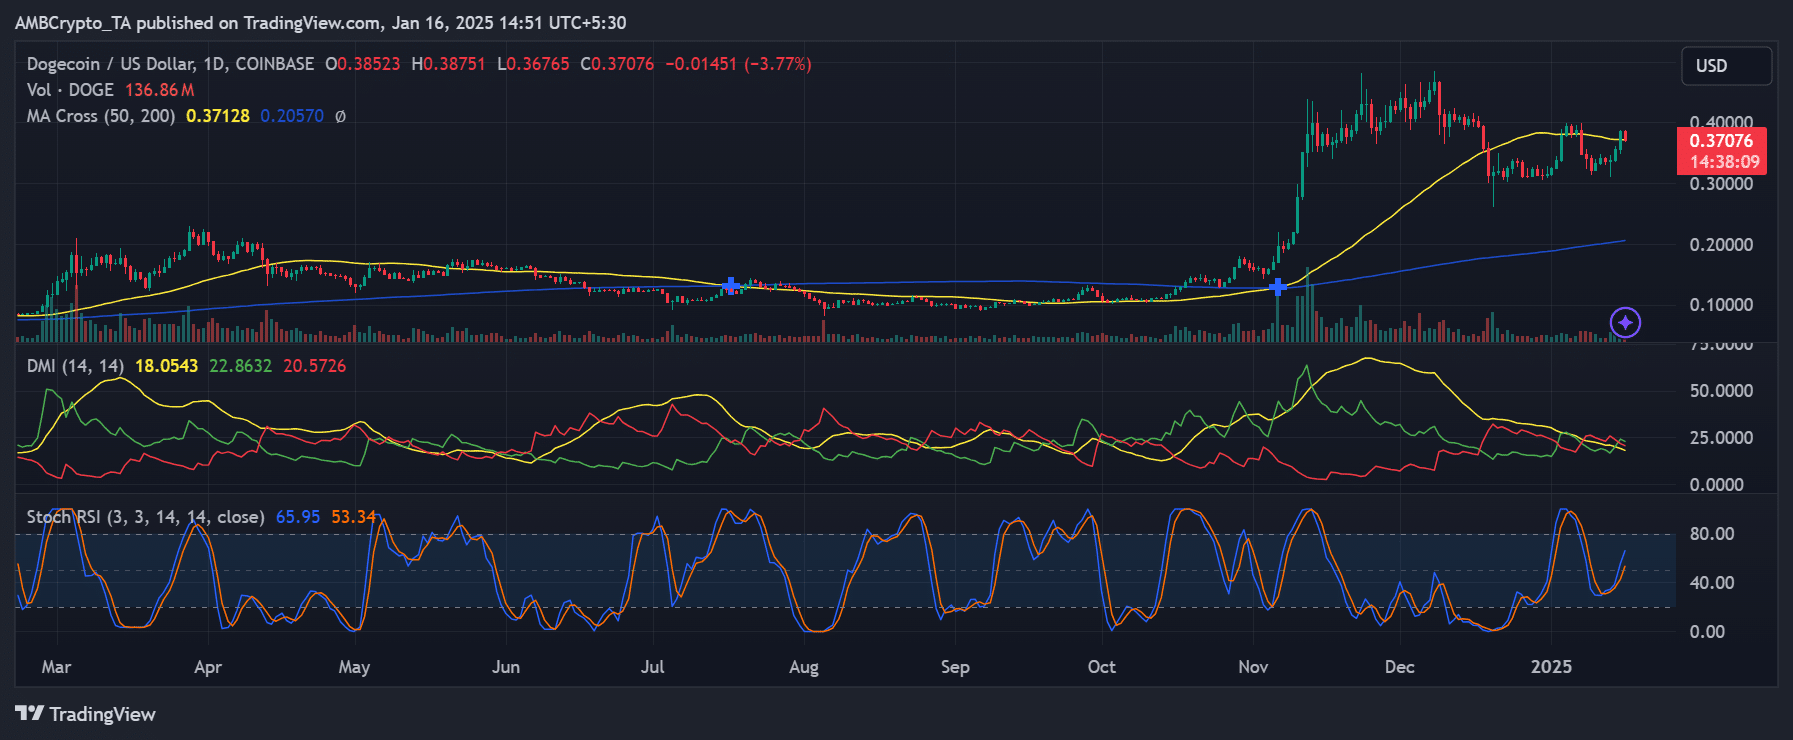
Source: TradingView
The MACD indicator reflects bullish momentum, with its signal line trending upwards. A divergence from the price at this stage could confirm a breakout, provided DOGE maintains volume support.
Network activity shows institutional interest
On-chain metrics reveal a substantial spike in daily active addresses during November, reaching peak levels not seen in months.
While activity has normalized, current levels remain elevated compared to Q3 2024, suggesting sustained network engagement despite price consolidation.
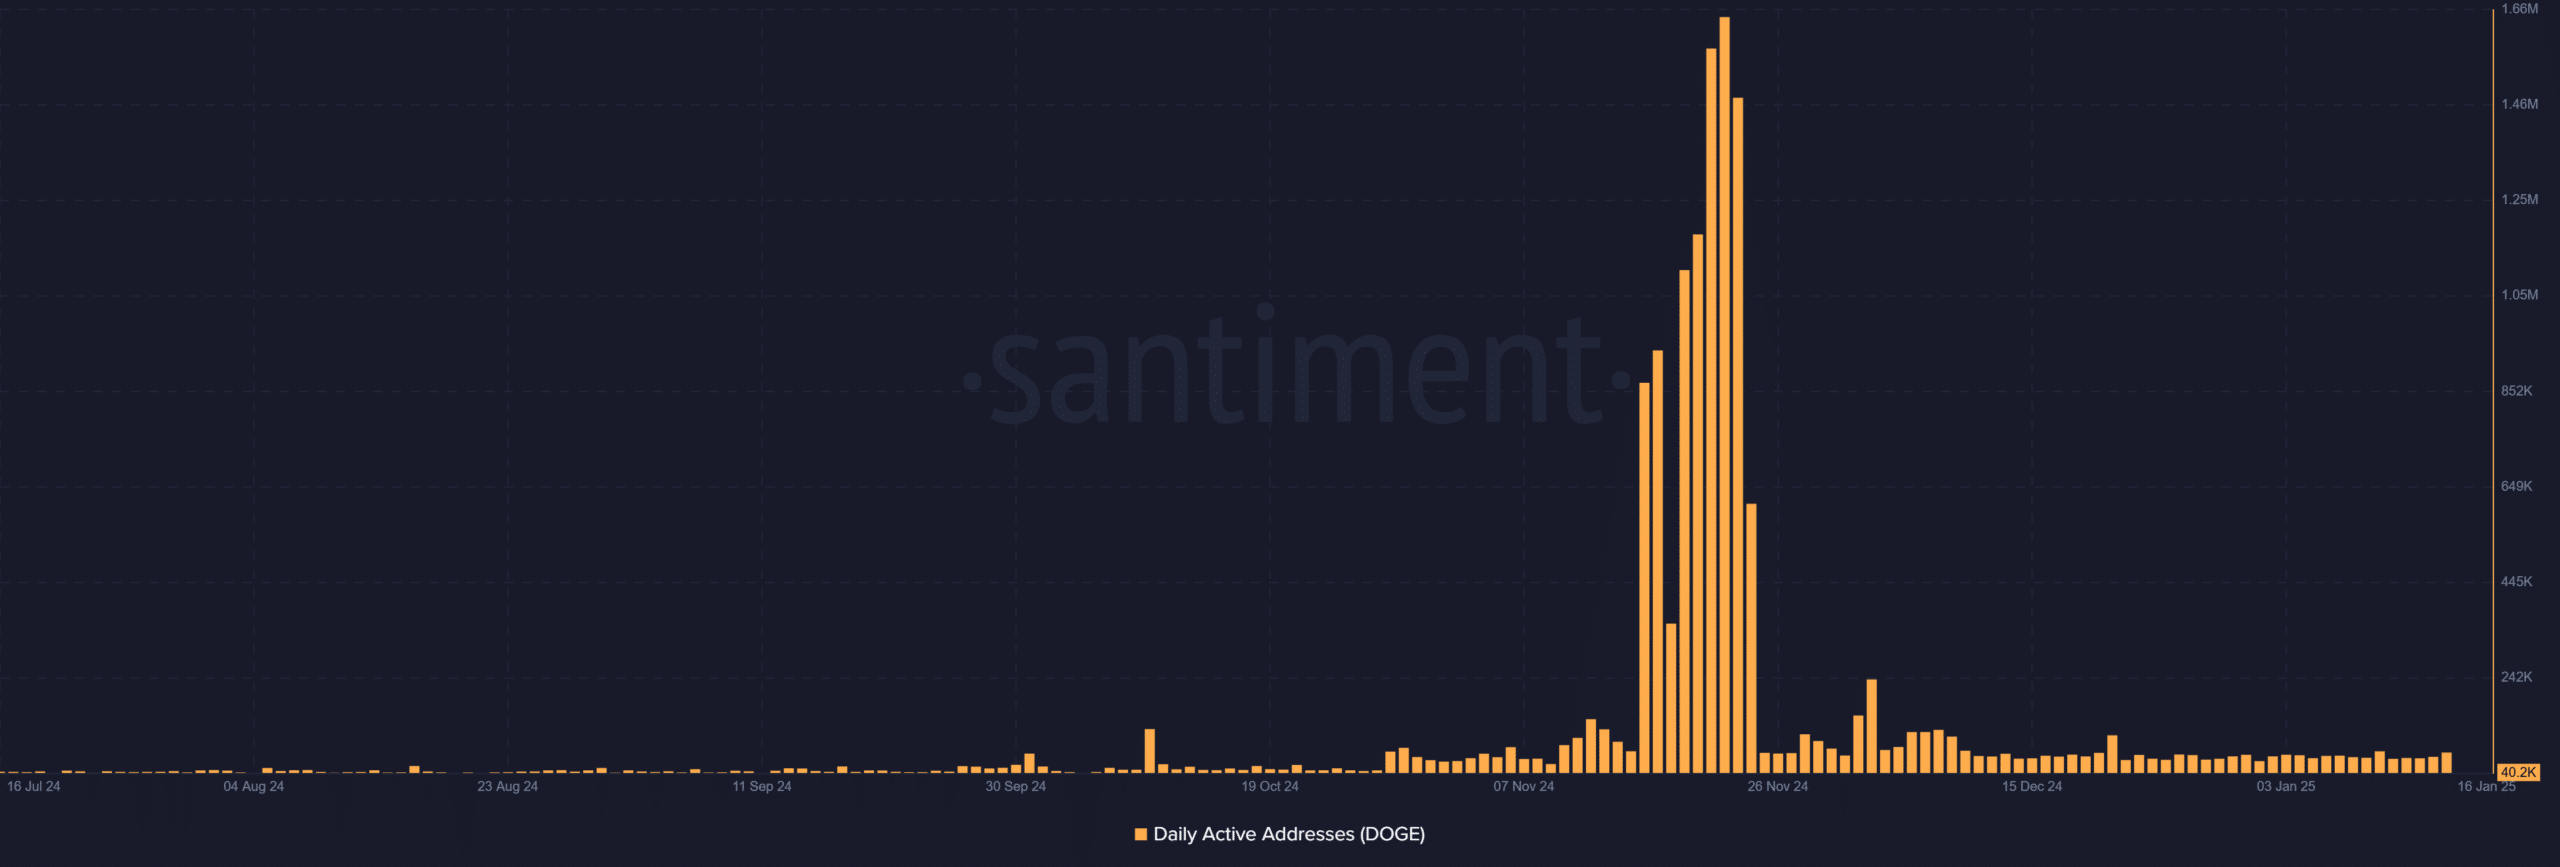
Source: Santiment
Historically, DOGE’s price has correlated positively with spikes in active addresses.
What lies ahead for DOGE?
The volume profile indicates significant support clustering around $0.33015 (0.5 Fibonacci level), with additional backing at $0.28968 (0.618 level).
A decisive break above $0.40000 could trigger acceleration toward the $0.45000 region, while the confluence of technical support at $0.31355 (0.382 Fibonacci) provides a safety net.
DOGE’s ability to maintain support above the 50-day MA while challenging the $0.40000 resistance will be crucial.
The convergence of multiple technical indicators suggests accumulation at current levels, though the break above key resistance requires substantial volume confirmation for sustainability.
– Is your portfolio green? Check out the Dogecoin Profit Calculator
The current market structure, supported by elevated network activity and strong technical foundations, presents a compelling case for continued upside potential, provided key support levels hold during pullbacks.