
- TON’s 7-day and 30-day realized volatility have hit unprecedented lows, marking a rare calm.
- Historically, low volatility in crypto markets often precedes sharp price movements in either direction.
Periods of calm are rare in the crypto market and often hint at seismic shifts on the horizon. Toncoin [TON] is experiencing one such moment.
Recent data reveals that the blockchain project’s 7-day and 30-day Annualized Realized Volatility has plunged to historic lows, signaling a phase of relative quiet.
For seasoned traders, this could be more than just a statistical anomaly. Historically, prolonged periods of low volatility in crypto markets have acted as precursors to sharp price movements, either upward or downward.
As TON enters this critical juncture, all eyes are on whether the current lull will transform into a breakout or a breakdown.
What is Annualized Realized Volatility?
Annualized Realized Volatility measures the actual historical price fluctuations of an asset over a specific period, expressed on an annualized basis.
This metric is pivotal in crypto markets because it highlights periods of stability or turbulence, offering traders insights into potential market behavior.
A low volatility phase often indicates a market in balance, but such equilibrium rarely lasts long in the highly speculative markets.
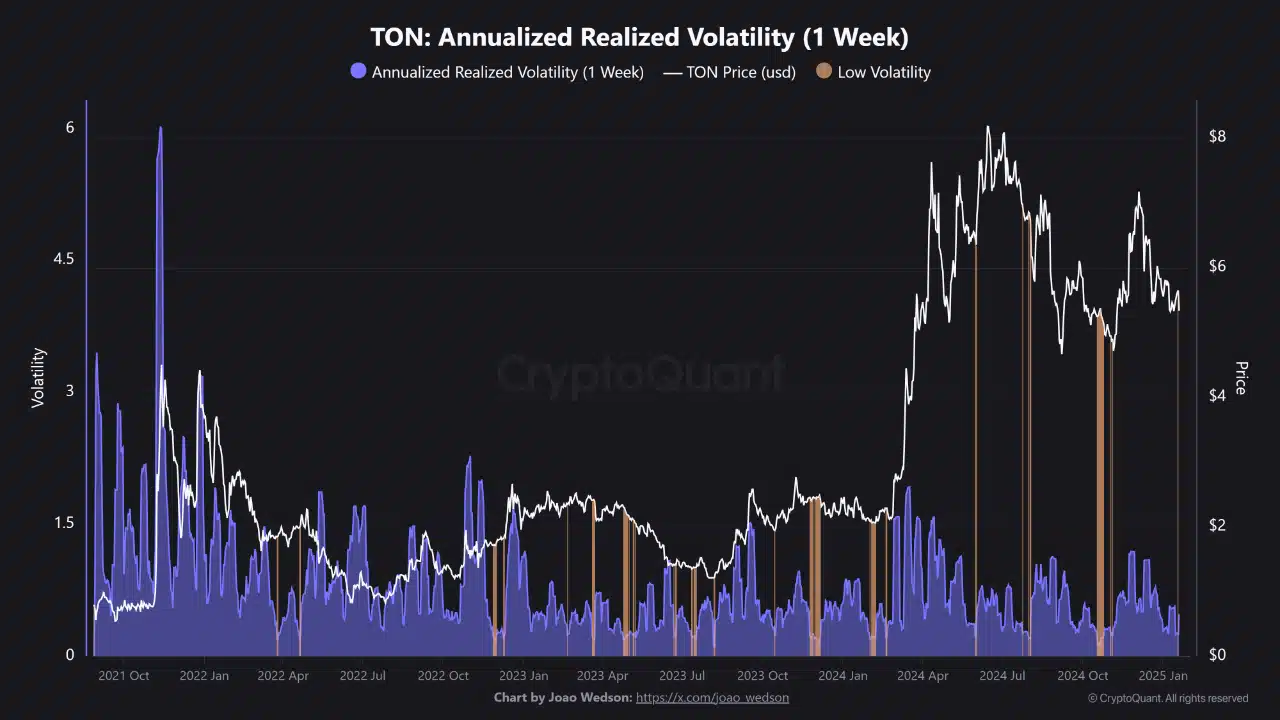
Source: CryptoQuant
TON’s 7-day Annualized Realized Volatility shows more short-term responsiveness to market movements, while the 30-day metric captures longer-term trends.
Currently, both metrics are at historical lows, signaling an unprecedented calm in TON’s price movements. This calm could precede significant market action, making it a critical metric to monitor.
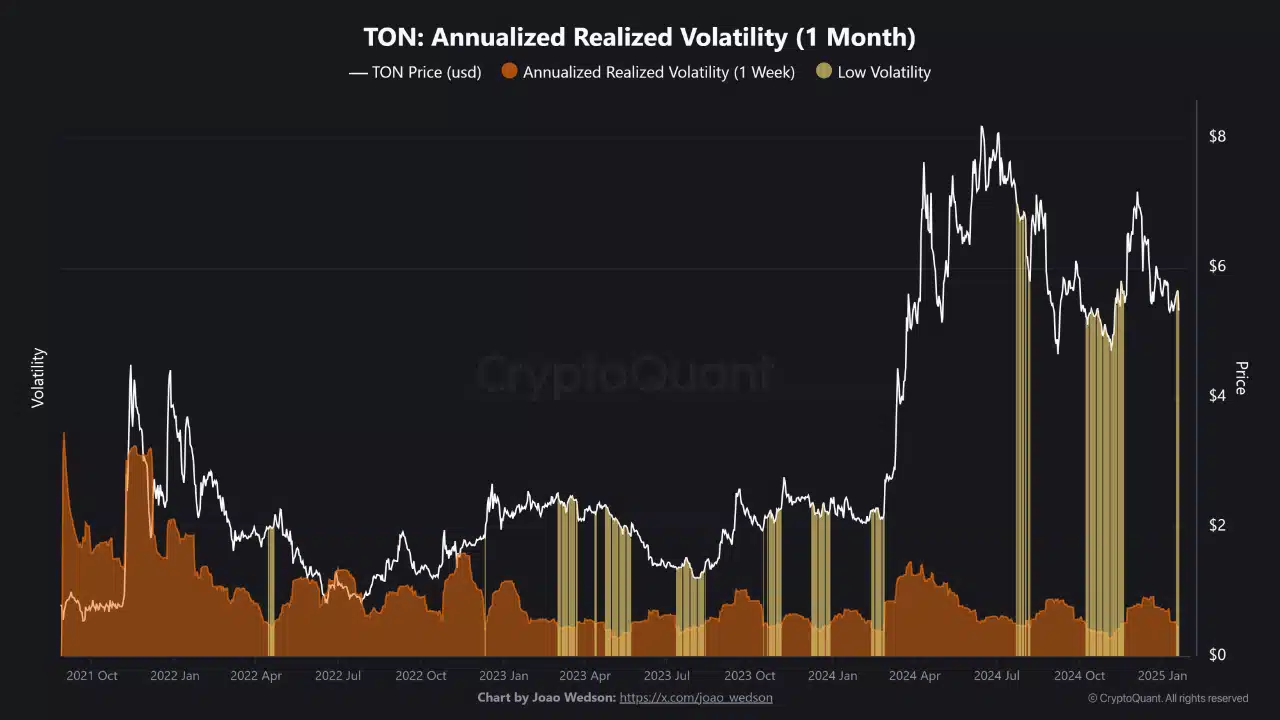
Source: CryptoQuant
Low volatility: A precursor to market movement
Low volatility typically signals reduced trading activity or investor interest, often reflecting a market in consolidation.
For TON, the current historic lows suggest an equilibrium, with neither buyers nor sellers driving strong price momentum. This dormancy phase, however, has historically served as the calm before the storm in crypto markets.
Examining TON’s history, periods of low volatility have frequently preceded sharp price changes. In mid-2022, after a prolonged low-volatility phase, TON’s price surged from $1.30 to over $2.00 within weeks—a 50% increase.
Similarly, in early 2023, low volatility led to a breakout that saw prices rise from $2.50 to nearly $4.50, marking an 80% rally.
Broader crypto trends reinforce this pattern. For instance, Bitcoin’s extended consolidation around $6,000 in 2018 led to a steep breakdown below $4,000. Ethereum showed similar behavior in mid-2020 before the DeFi bull run began.
Read Toncoin’s [TON] Price Prediction 2025-26
What could be ahead for TON?
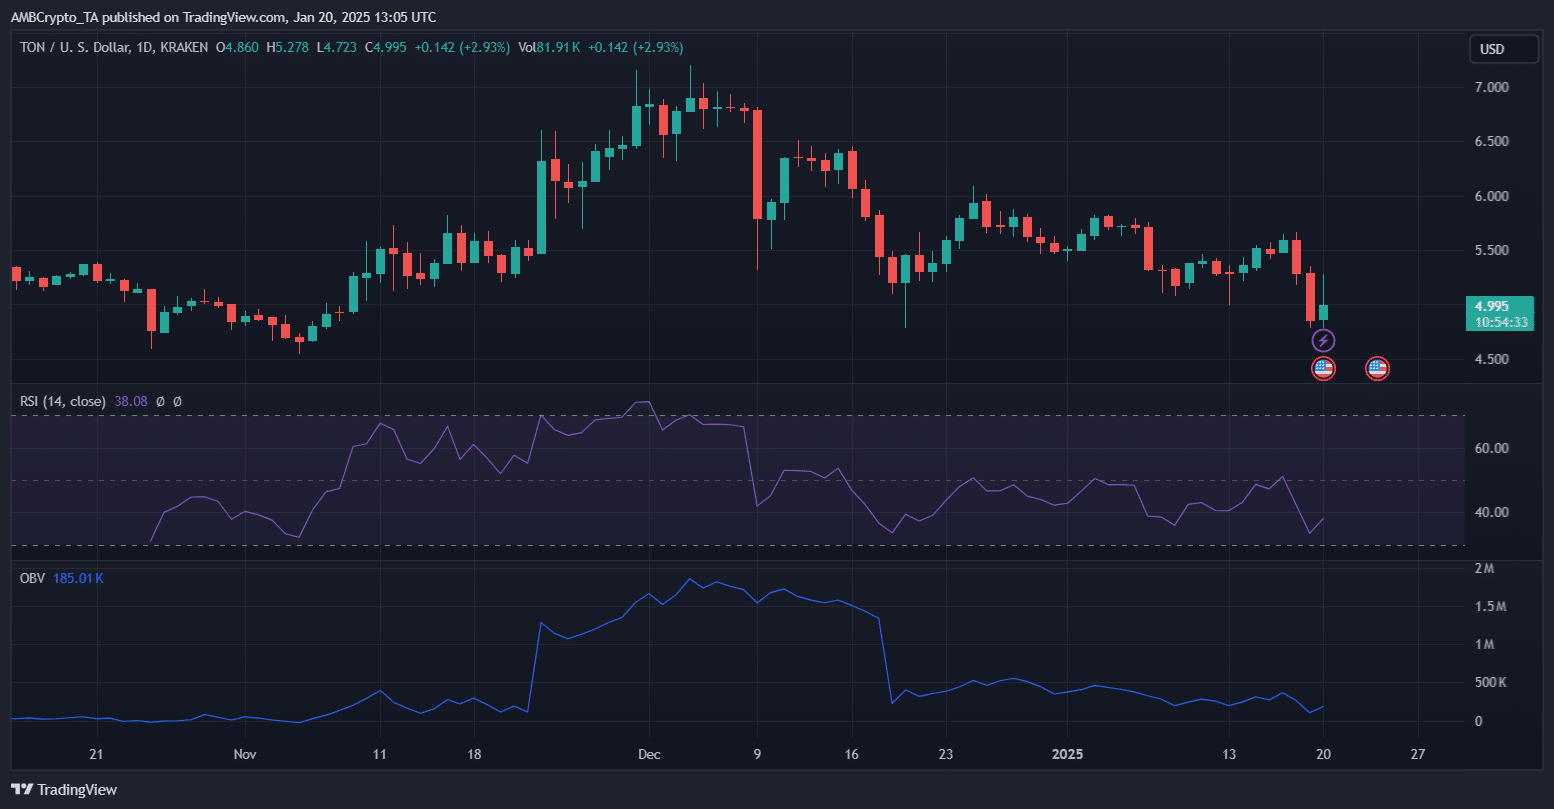
Source: TradingView
TON’s low volatility hints at a critical juncture. The RSI indicates mild bearish momentum, but not oversold conditions yet. This suggests that sellers dominate, but exhaustion may be near.
Meanwhile, OBV reflects declining volume, confirming reduced trading activity—a classic low-volatility signal.
Upside potential could stem from a reversal in RSI alongside renewed buying interest. A break above the $5.50 resistance could trigger bullish momentum, targeting $6.00 or beyond.
Conversely, a breach below $4.70 support, combined with persistently low OBV, might signal further declines toward $4.30.
External factors, such as market trends or ecosystem developments, will likely determine the direction of the impending breakout.