
- ETH has surged over the past 24 hours by 5.41%.
- Although Ethereum is under pressure, the altcoin could recover in the short term before another decline.
Over the past three weeks, Ethereum [ETH] has struggled to maintain an upward momentum. Over this period, the altcoin has remained stuck within a consolidation range between $3.2k and $3.5k.
This prolonged consolidation has left analysts concerned about ETH’s future trajectory. Notably, CryptoQuant analyst Fost has suggested that Ethereum is facing extreme pressure.
Is Ethereum under pressure?
According to CryptoQuant, Ethereum is facing high FUD and bearish sentiment, resulting in altcoin’s continued underperformance.
Firstly, Ethereum’s netflow on Binance indicates that inflows have dominated since September 2024. This period saw six days with inflows exceeding 100k ETH, compared to one day with the same outflows.
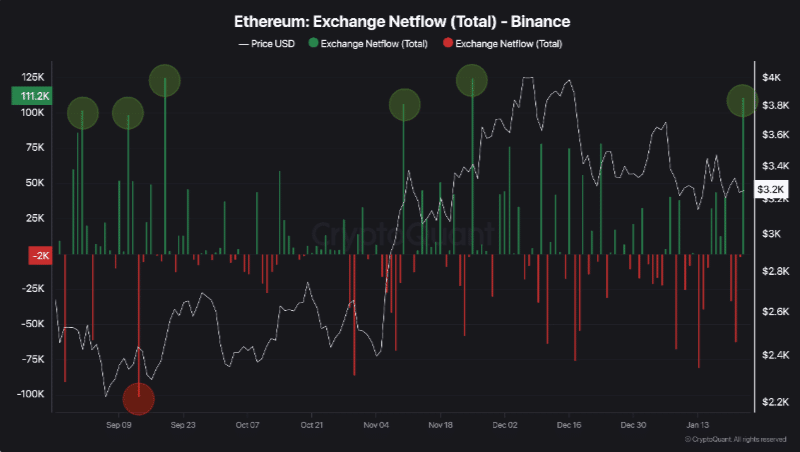
Source: CryptoQuant
Secondly, Ethereum’s reserve on Binance has surged from 3.6 million ETH in September to 4.3 million ETH as of this writing with a peak of over 4.5 million ETH, adding almost 1 million ETH in a month.
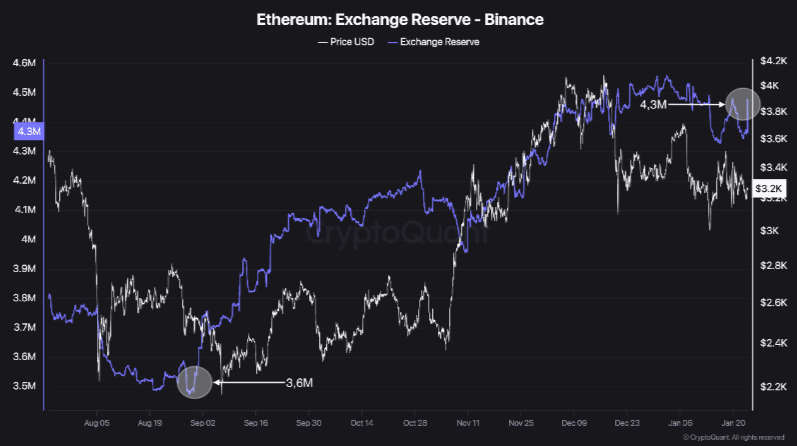
Source: CryptoQuant
Finally, between September and December 2024, Ethereum’s Open Interest(OI) increased, fueling ETH’s uptrend as long positions dominated.
However, OI has declined since December with 7 EMA crossing below the 50 EMA, which is a bearish crossover.
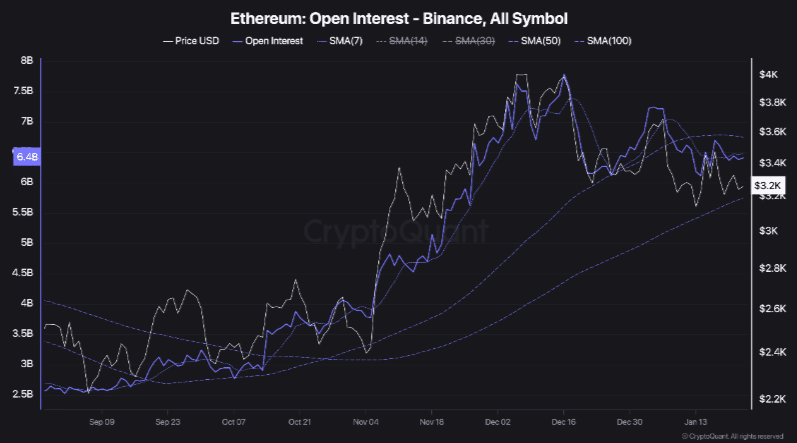
Source: CryptoQuant
Therefore, this data indicates that Ethereum is in a bearish phase. As such, investors have remained cautious by selling to secure profits when ETH makes slight gains.
What ETH’s charts suggest
Undoubtedly, Ethereum is currently facing massive pressure with bears having the upper hand. However, in the short term, ETH is signaling a potential reversal to the upside.
According to AMBCrypto’s analysis, Ethereum was seeing short-term demand, which could position the altcoin for some gains.
Source: CryptoQuant
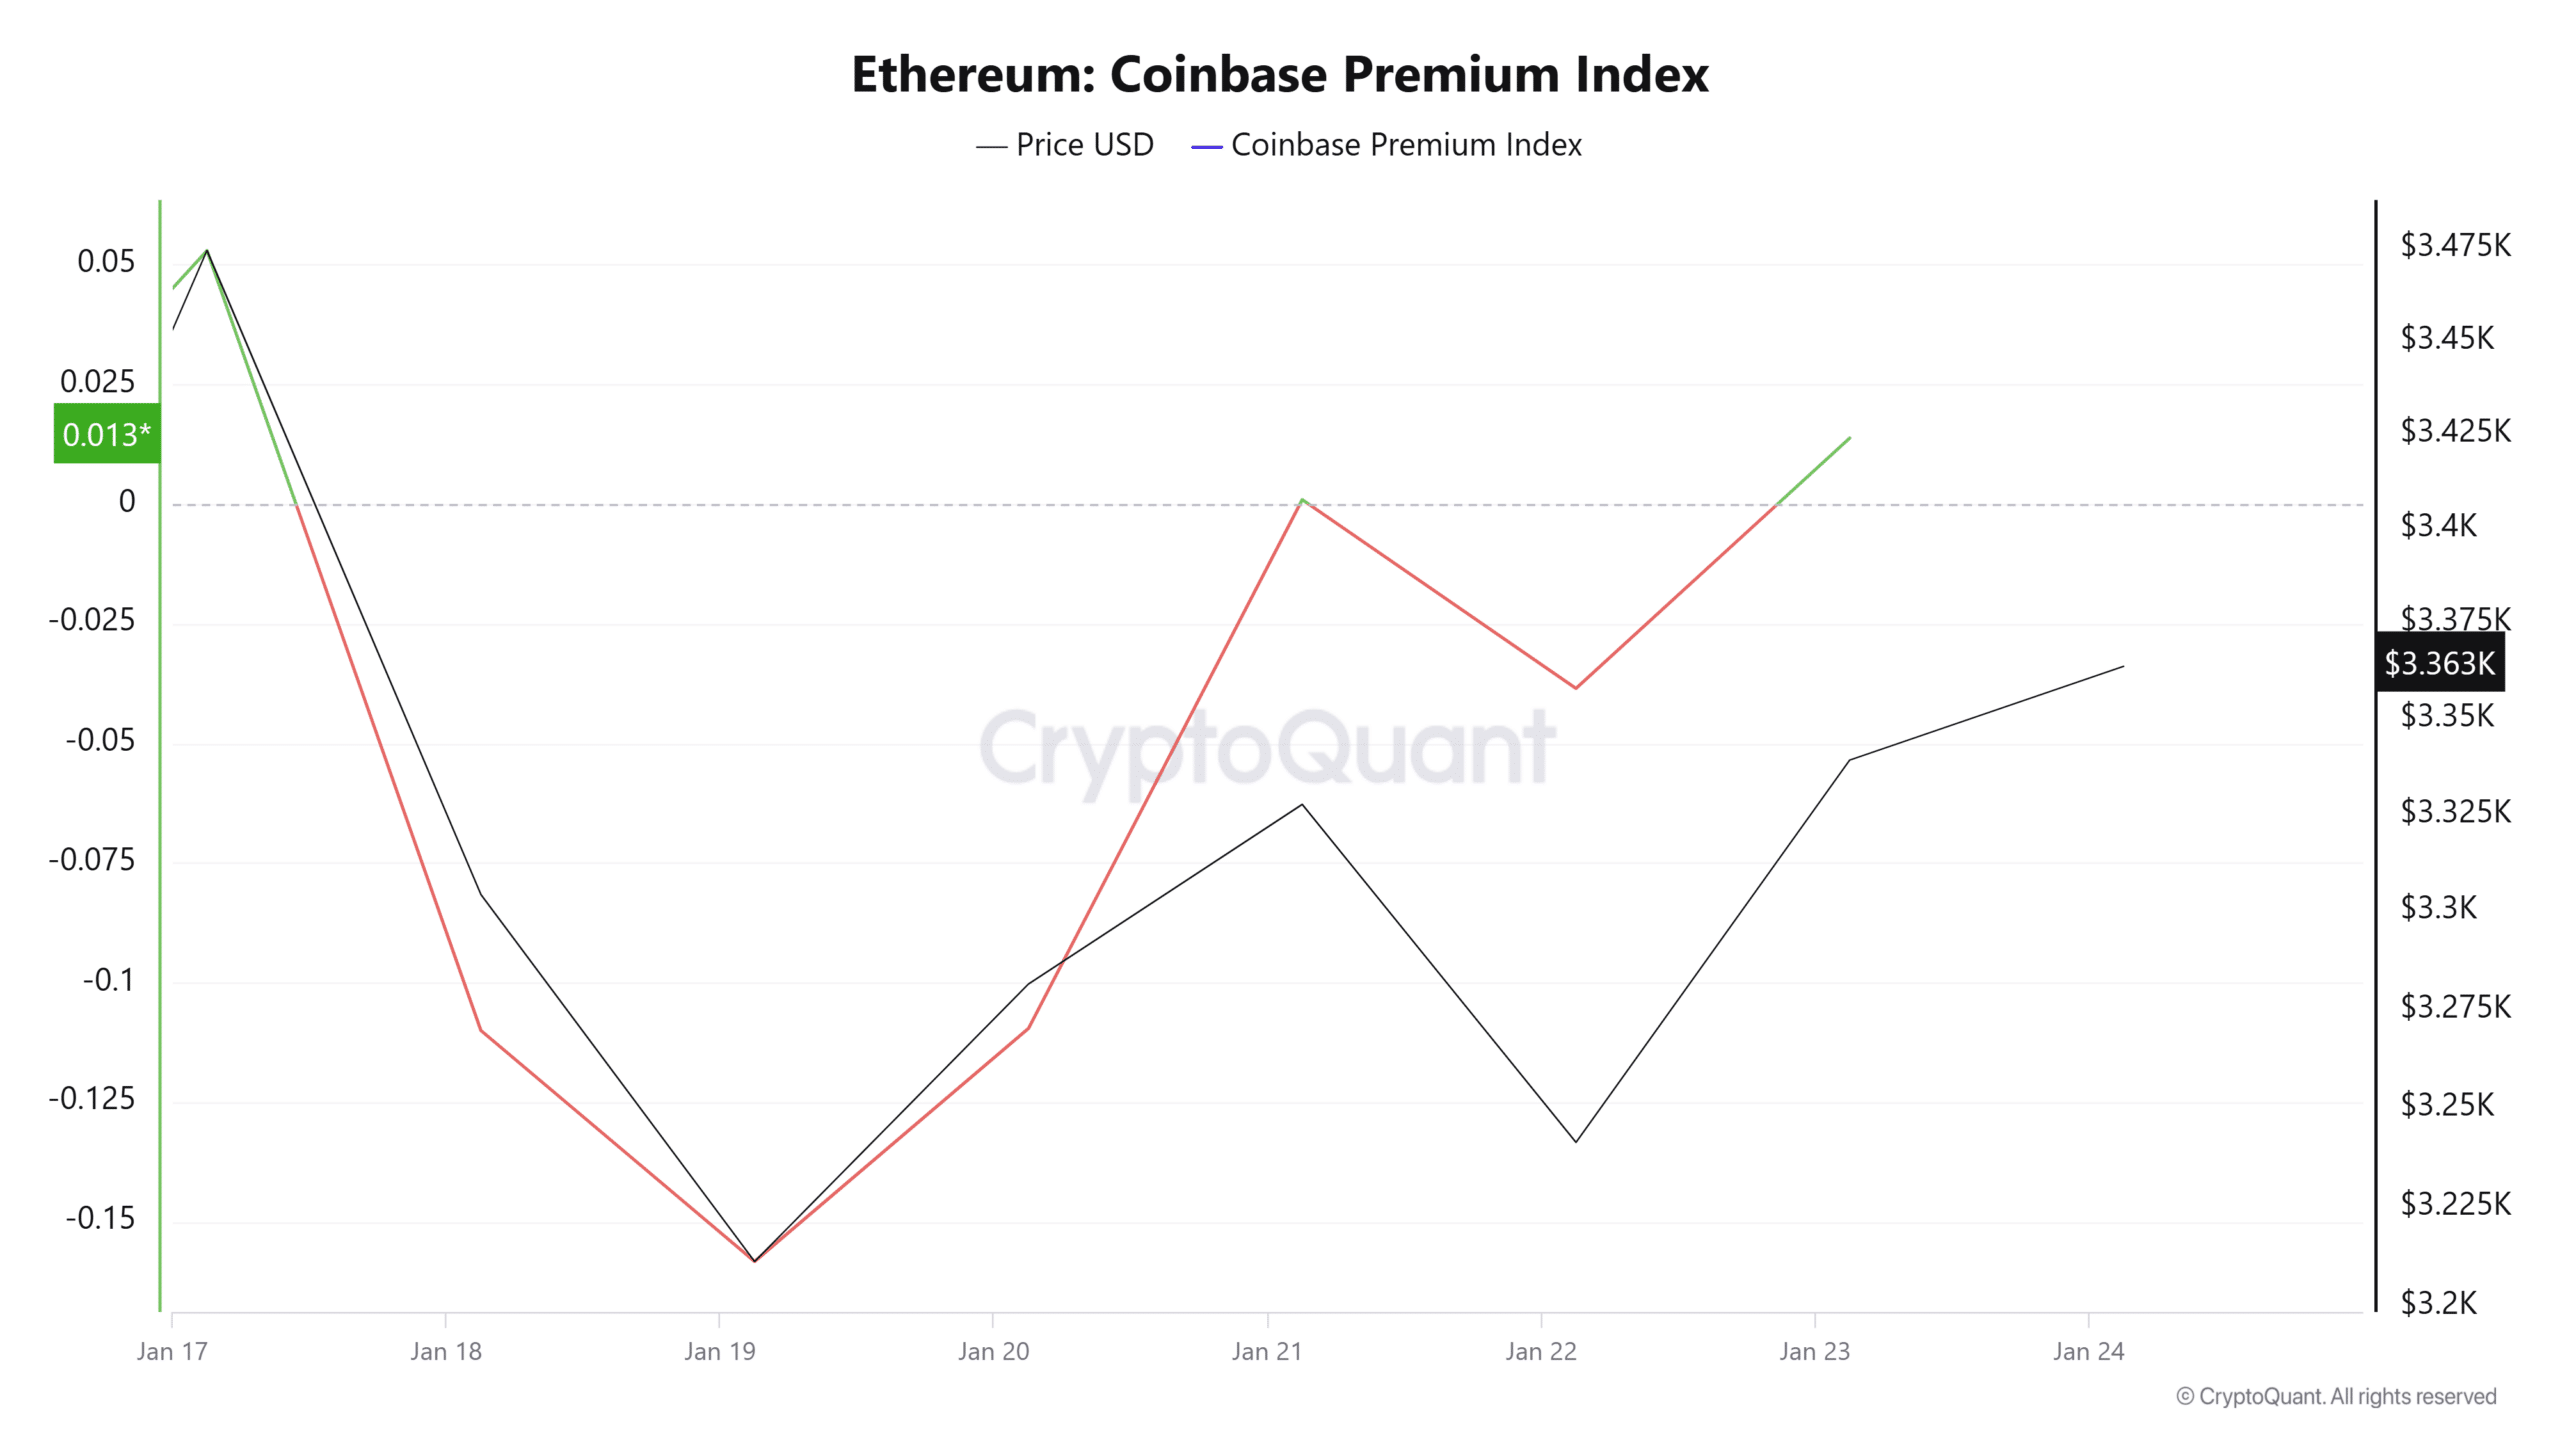
For example, Ethereum’s Coinbase Premium Index has turned positive after dropping to a three-week low.
When this turns positive, it implies that ETH is experiencing a high demand from U.S. investors and institutions. As such, U.S. traders are bullish and expect prices to increase in the near term.
Source: CryptoQuant
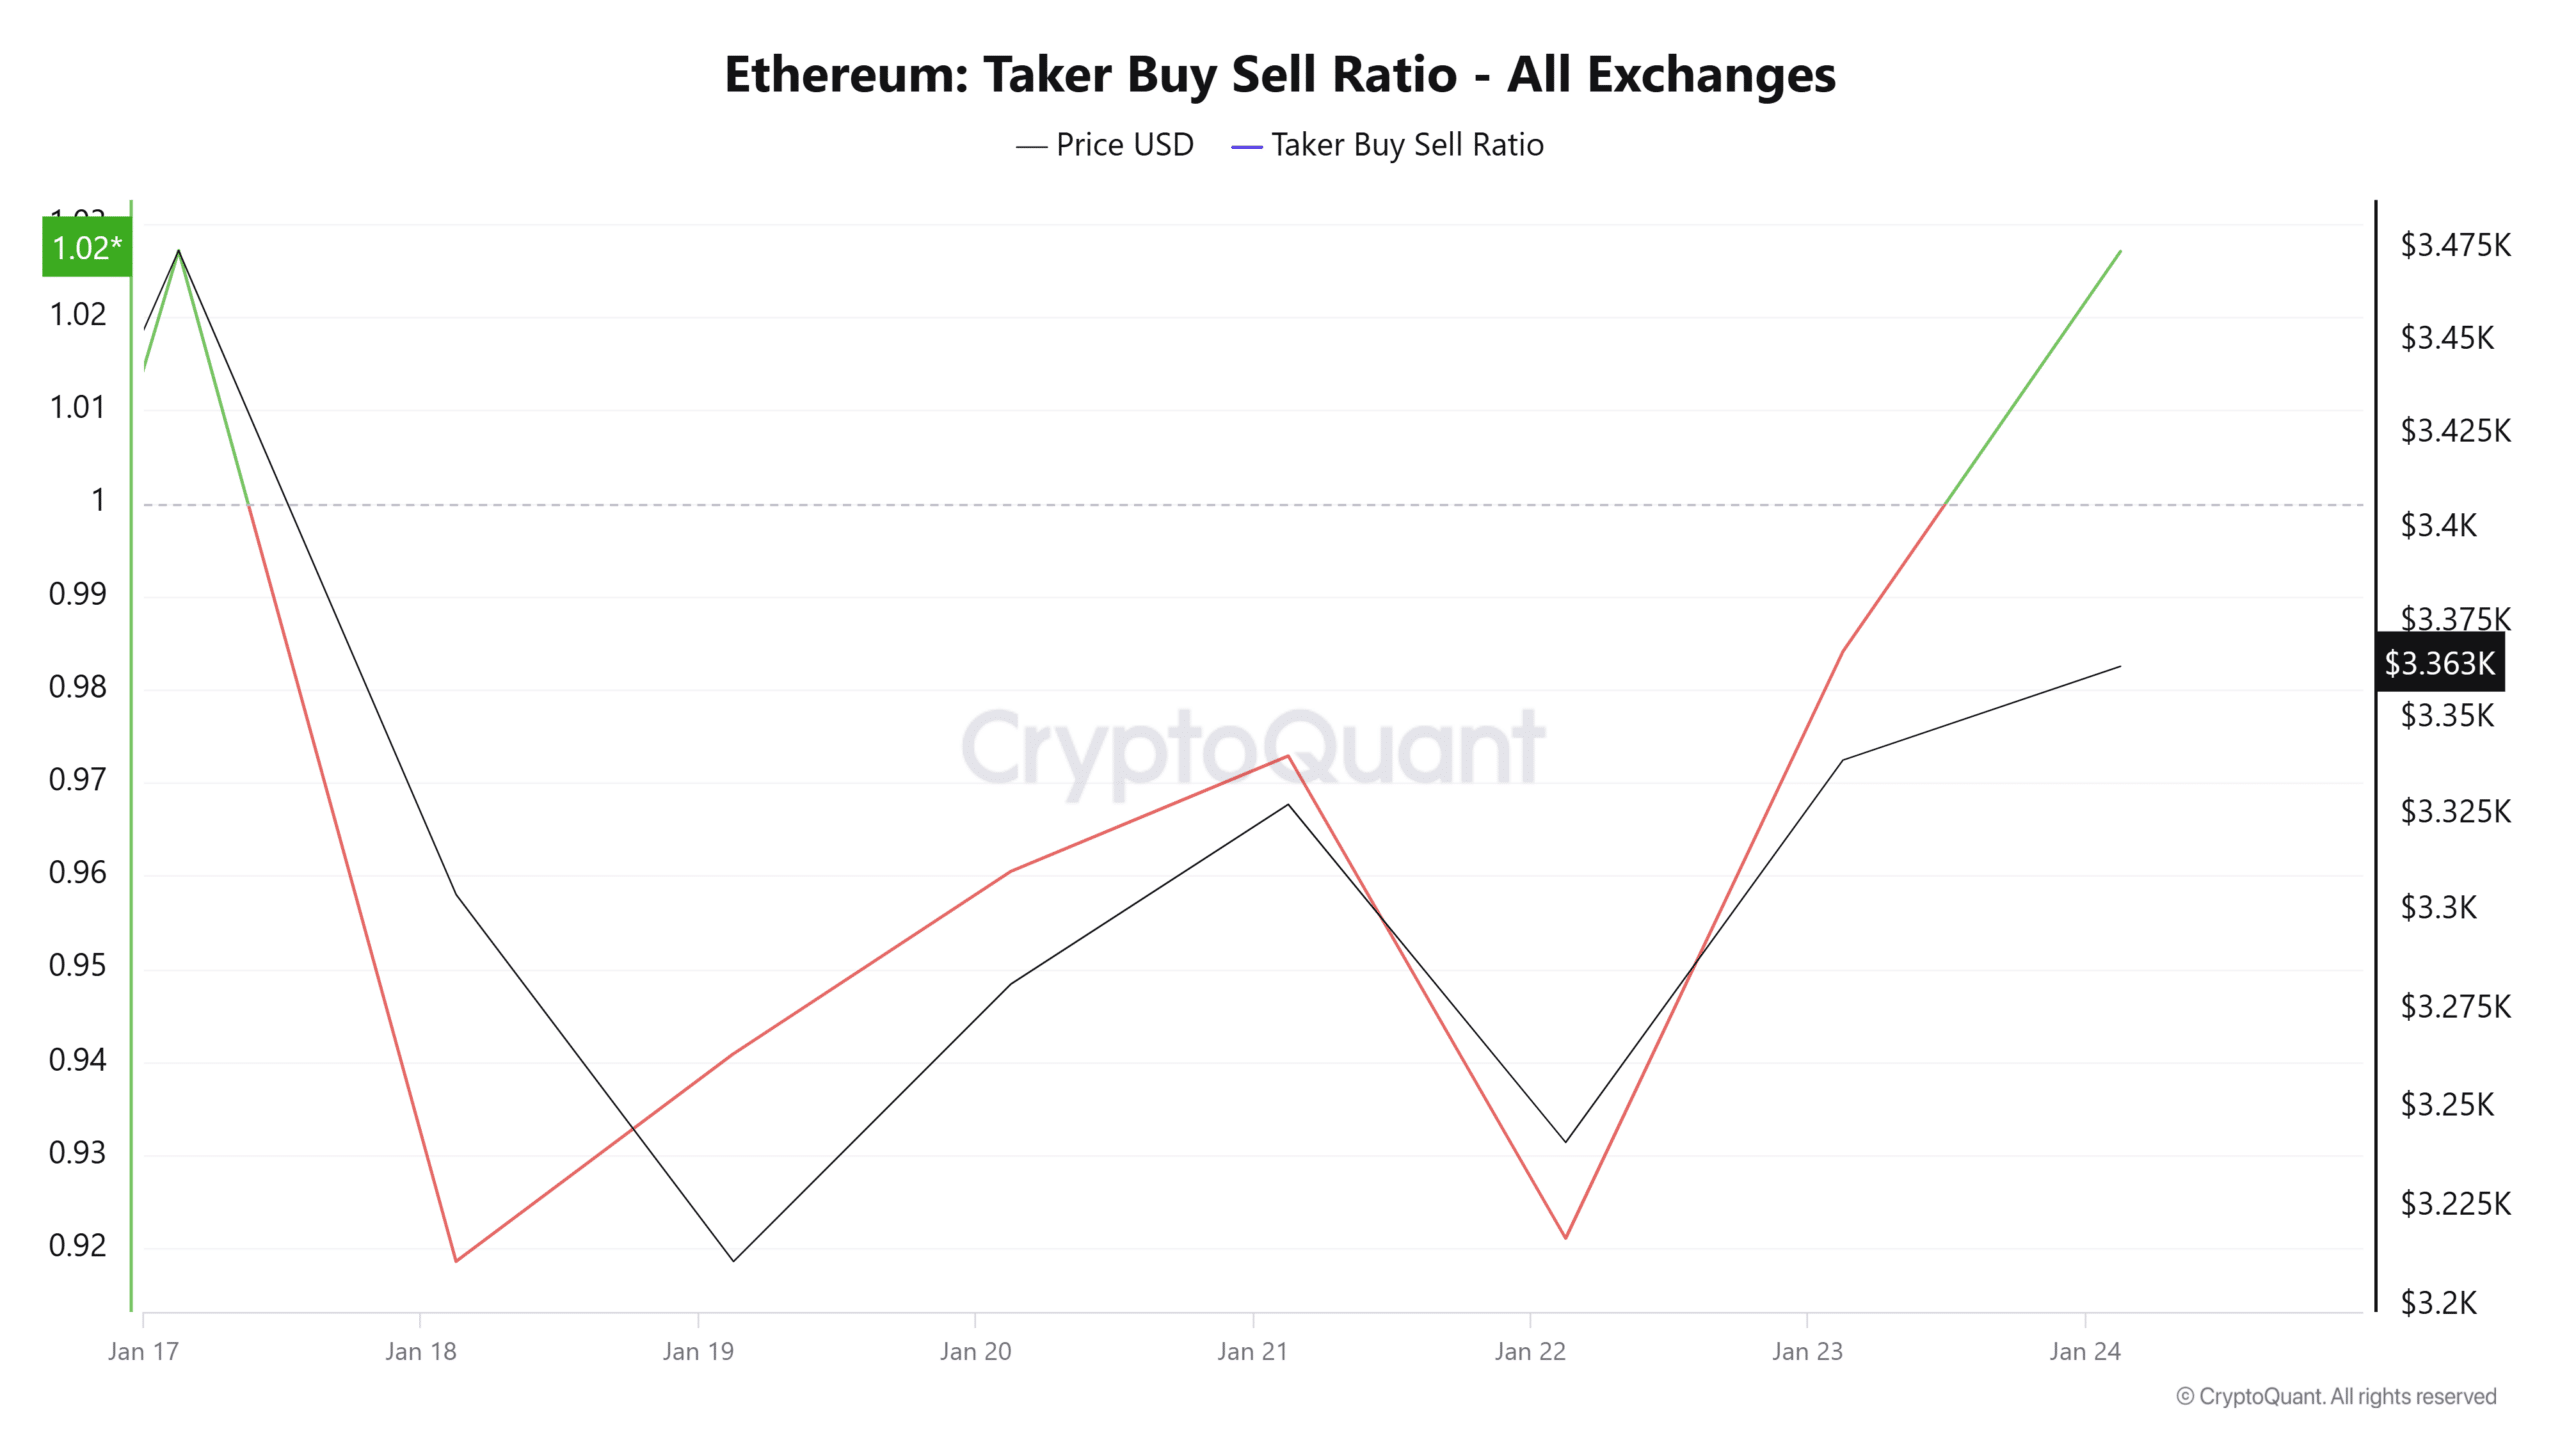
Additionally, Ethereum’s Taker Buy-Sell Ratio has also surged to surpass 1 for the first time this week.
With this metric sitting at 1.05, it suggests that ETH is experiencing strong buying pressure. As such, buyers are currently outpacing sellers.
Source: Santiment
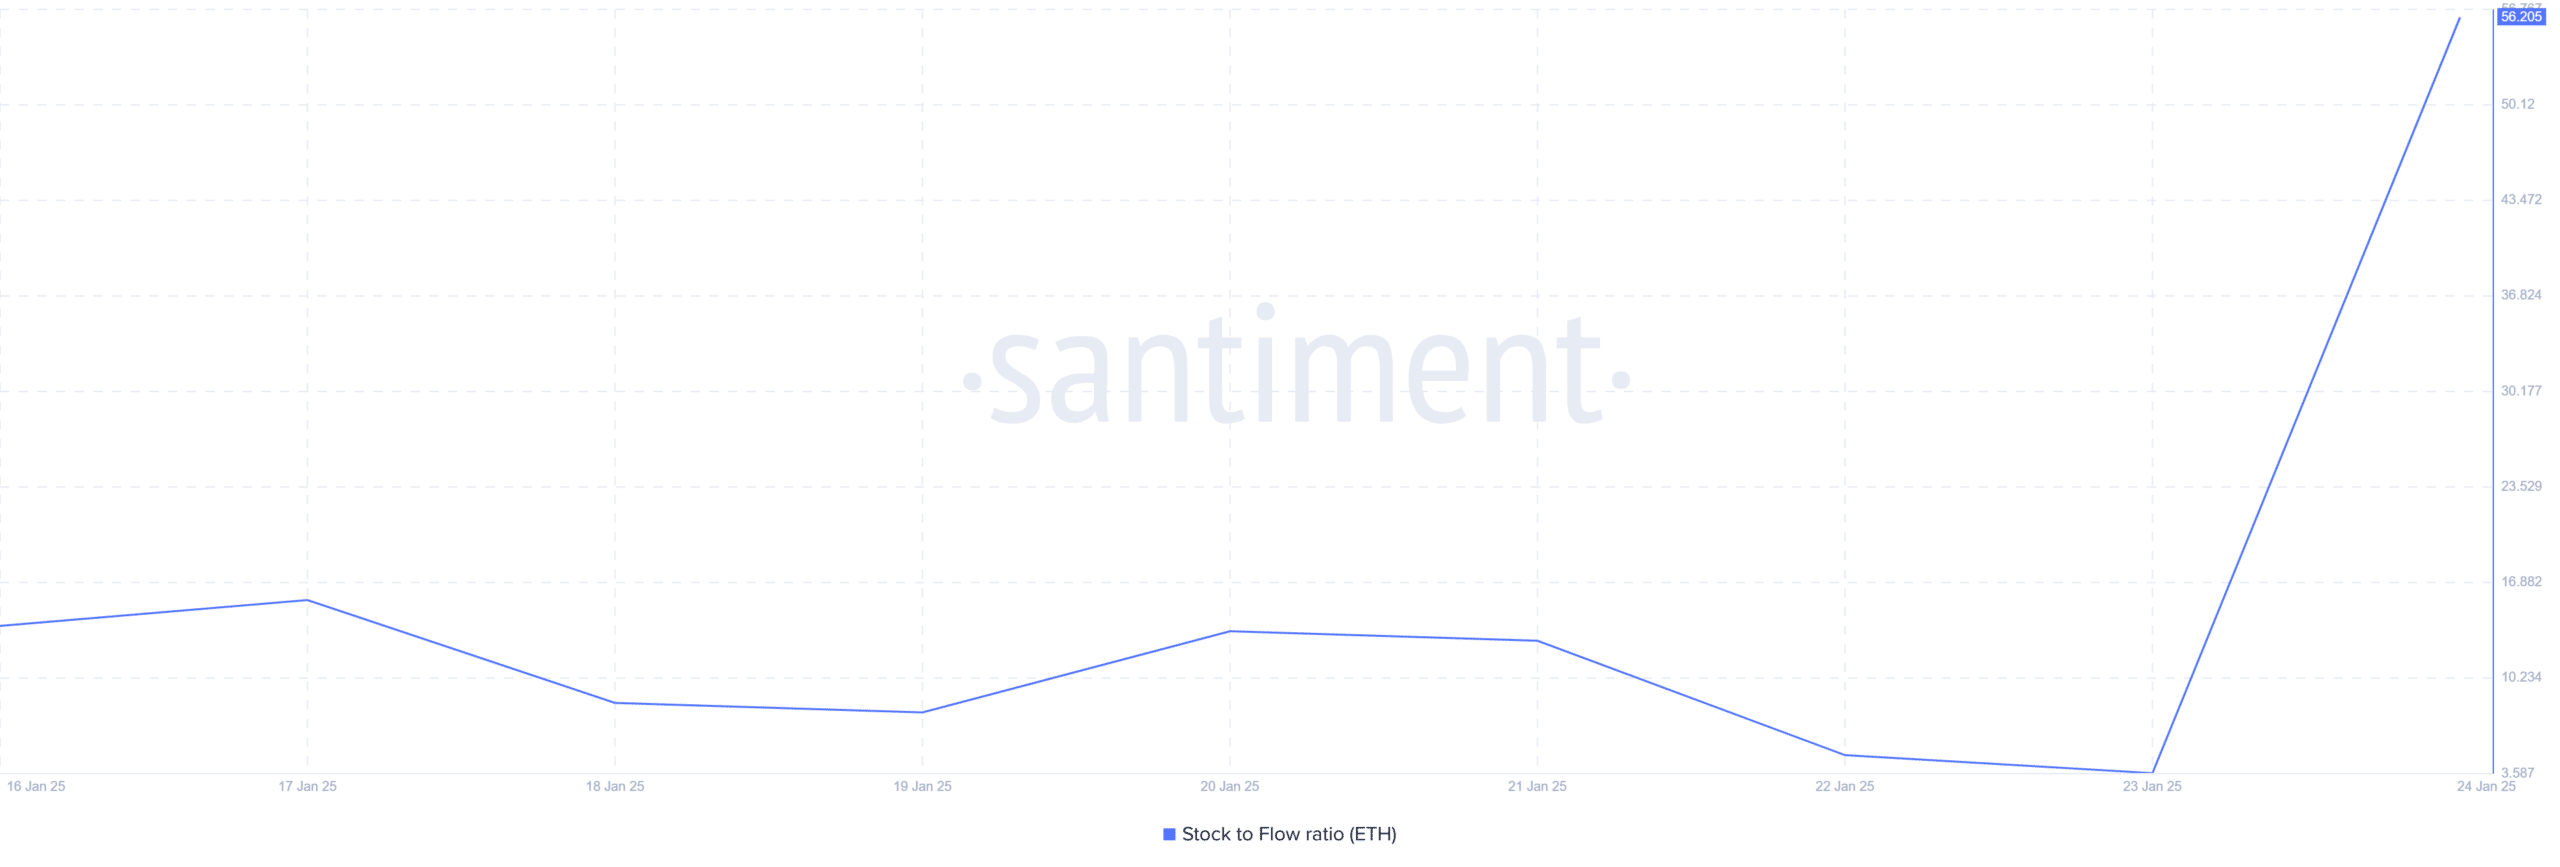
Finally, we can see Ethereum’s scarcity is rising. This is evidenced by a spike in stock to flow ratio, which has reached 56 from 3.2. Such an uptick suggests increased accumulation as investors store the ETH off exchanges.
This scenario leads to reduced supply, which could raise prices if demand remains constant or rises.
What next for the altcoin?
In conclusion, although Ethereum is experiencing high pressure, the market has signaled a short-term recovery in the past 24 hours.
Current market conditions indicate a potential breakout from this consolidation range.
Read Ethereum’s [ETH] Price Prediction 2025-26
In the short term, if buyers maintain the appetite observed over the past day, ETH could reclaim $3,500 and attempt a $3,700 resistance level. For this bullish outlook to hold, ETH must reclaim and hold above $3,500.
If the latest attempt by buyers fails to boost the market, ETH could drop to $3,240, with a further dip to $3,000 possible.