
- JasmyCoin bounced off the $0.00380 support, with the falling wedge breakout targeting $0.03477 to $0.0580
- Bearish on-chain data seemed contrary with bullish technical indicators
JasmyCoin (JASMY), at press time, was forming a falling wedge pattern on the daily timeframe – A structure often associated with bullish reversals. In fact, the wedge featured a descending resistance line at the top and a descending support line at the bottom.
JASMY’s price has been testing the lower boundary of this pattern lately, bouncing off the 200-day moving average (MA 200) near $0.00380. This bounce hinted at possible bullish momentum on the charts, setting the stage for a breakout scenario.
In fact, according to crypto analyst Jonathan Carter,
“A potential breakout could propel Jasmy’s price toward targets at $0.03477, $0.0365, $0.0410, $0.0490, and $0.0580.”
These targets align with the altcoin’s historical price action and volume clusters, presenting realistic levels for bullish continuation if the wedge is breached to the upside.
Key support and resistance levels
At press time, JASMY was supported by the $0.00360 to $0.00380 zone, where the lower wedge boundary and the MA 200 converge.
This area has provided consistent support and seemed to underpin the crypto’s price action. On the upside, the resistance was located near $0.00500, where the upper boundary of the wedge and the horizontal resistance aligned with each other.

Source: TradingView
If the price breaks above this resistance, traders may expect JASMY to target higher levels, as outlined by the falling wedge’s breakout potential.
However, failure to maintain support at the lower boundary could lead to a retest of lower levels. This will potentially invalidate the existing bullish structure.
Technical indicators signal neutral to bullish momentum
At press time, the Relative Strength Index (RSI) for the altcoin had a reading of 42.90, indicating neutral to slightly oversold conditions. A rising RSI would confirm increasing bullish momentum. Especially if the price breaks out of the wedge.
The 200-day moving average (MA 200) has also acted as a strong support level, reinforcing the prevailing bullish setup.
On-chain data, however, painted a mostly bearish picture. According to IntoTheBlock, metrics such as Net Network Growth (-1.01%), In the Money (-4.09%), and Large Transactions (-3.15%) underlined reduced network activity and profitability.
Together, these findings hinted at cautious market sentiment during the consolidation phase.
Market activity and liquidation trends
Data from IntoTheBlock also showed that large transactions (≥$100,000) peaked at 47, but dropped to 25 in the last 24 hours. This can be seen as a sign of declining interest from high-value traders.
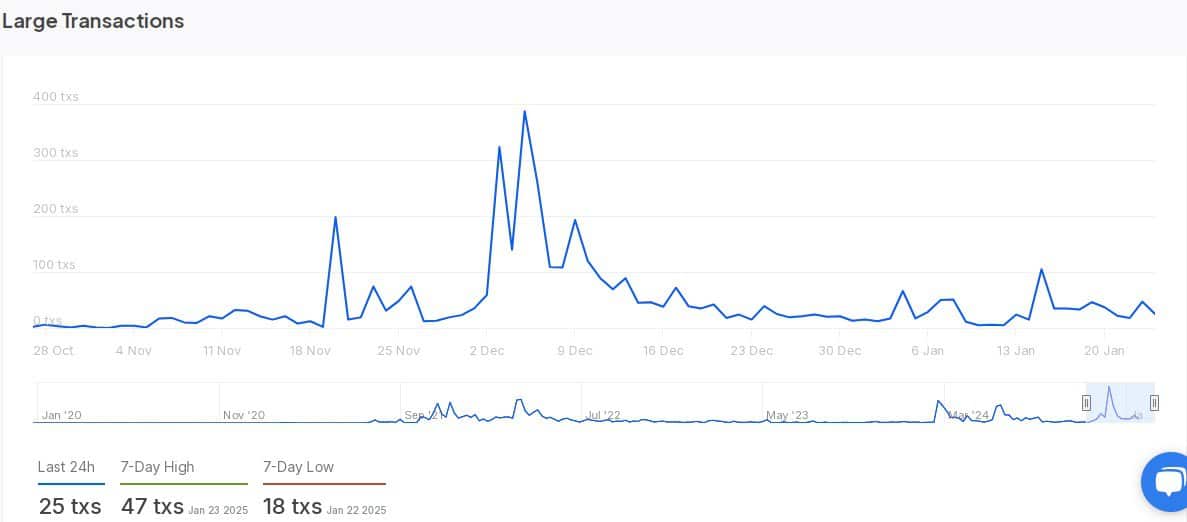
Source: IntoTheBlock
The latest drop in transaction volume aligned with lower address activity too. Especially as new addresses fell by 4.94% and active addresses dipped by 12.97% over the past week.
Finally, liquidation data revealed that there were $74.4k liquidations over the last 24 hours – $49.8k in long positions and $24.6k in short positions.
Spikes in liquidation on 20 January exceeded 80k contracts too, highlighting high volatility earlier in the week.
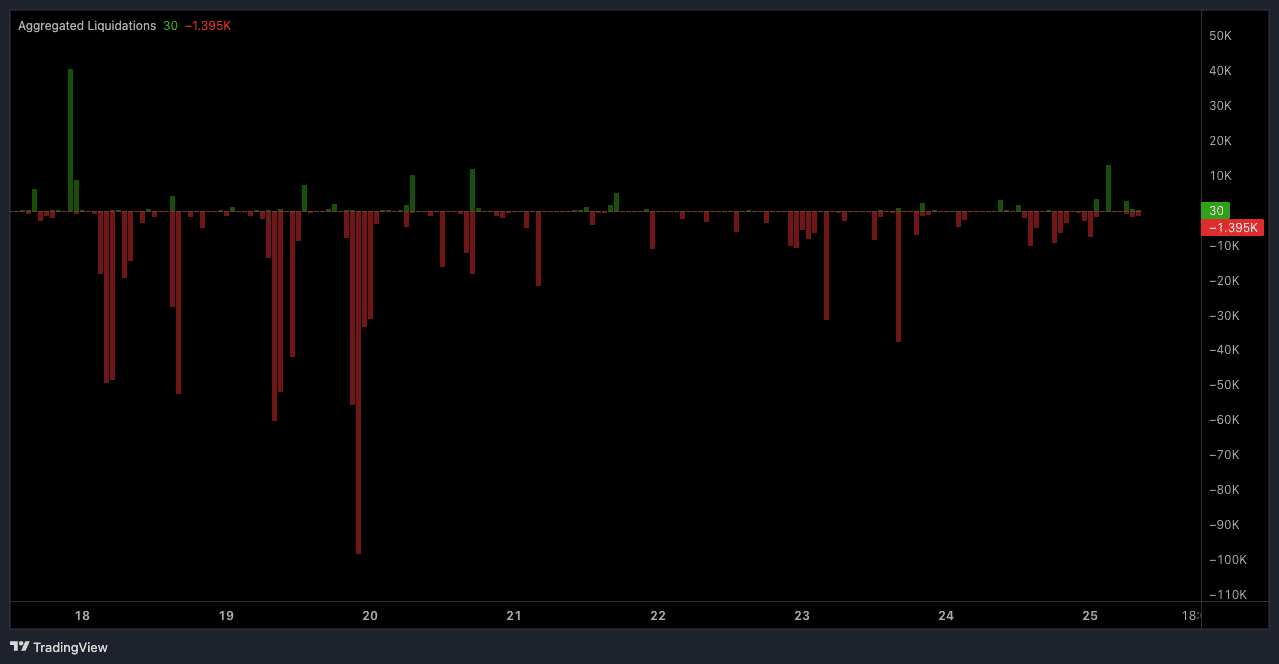
Source: Coinalyze
To put it simply, press time data hinted at reduced market activity, suggesting a period of stabilization following significant liquidation events.
Jasmy’s falling wedge pattern seemed to allude to a bullish technical setup too. If a breakout occurs, the price could hit key targets, driven by technical strength and a hike in participation.