
Ethereum experienced one of the most chaotic trading days in its history last Monday, as it plunged over 30% in less than 24 hours amid escalating U.S. trade war fears. However, the market quickly rebounded after President Trump announced negotiations with Canada and Mexico, leading to a sharp recovery across crypto assets.
Related Reading
Despite this rebound, Ethereum remains significantly weaker than other altcoins, raising concerns about how long this underperformance will last. Investors are closely watching price action, as ETH continues to trade at historically low levels relative to Bitcoin and other altcoins.
Top analyst Carl Runefelt shared a technical analysis on X, revealing that Ethereum is holding onto a key horizontal support level on the ETHBTC chart. This suggests that ETH could be at a turning point, with a potential opportunity for recovery if bulls step in. However, failure to hold this level could indicate further downside ahead.
With Ethereum lagging behind its peers, sentiment remains mixed, and market participants are waiting for a clear confirmation of trend direction. Will ETH finally start catching up, or is another leg down still on the table? The next few weeks will be crucial.
Ethereum Faces Uncertainty After Record Liquidations
Ethereum has struggled after one of the most brutal liquidation events in crypto history, with over $8 billion wiped out from the market between Sunday night and Monday. ETH was one of the hardest-hit assets, with price action looking weak and uncertain compared to Bitcoin. This has sparked concerns among analysts, who fear Ethereum’s underperformance could continue.
However, top analyst Carl Runefelt remains optimistic. He shared a technical analysis on X, revealing that Ethereum is holding a crucial horizontal support level on the ETHBTC chart around 0.028. Runefelt believes that if ETH bounces from this level, it could trigger a massive parabolic move, marking the beginning of a long-awaited altseason.
Ethereum has lagged behind BTC since late 2021, failing to reclaim its dominance despite multiple market rallies. While Bitcoin continues to flirt with all-time highs, ETH remains far from its previous peak, and many traders are now questioning whether Ethereum can regain its strength.
Related Reading
For now, Ethereum remains at a make-or-break level, with key support holding but pressure building. If ETH manages to surge from this zone, it could lead to a strong recovery and shift market sentiment. However, failure to hold support could mean further downside ahead.
Can Bulls Reclaim Momentum?
Ethereum is trading at $2,780 after testing two critical moving averages—the 200-day moving average at $2,482 and the 200-day exponential moving average at $2,288. These indicators have been key long-term support levels since July 2020, confirming that Ethereum’s macro trend remains intact despite recent volatility.
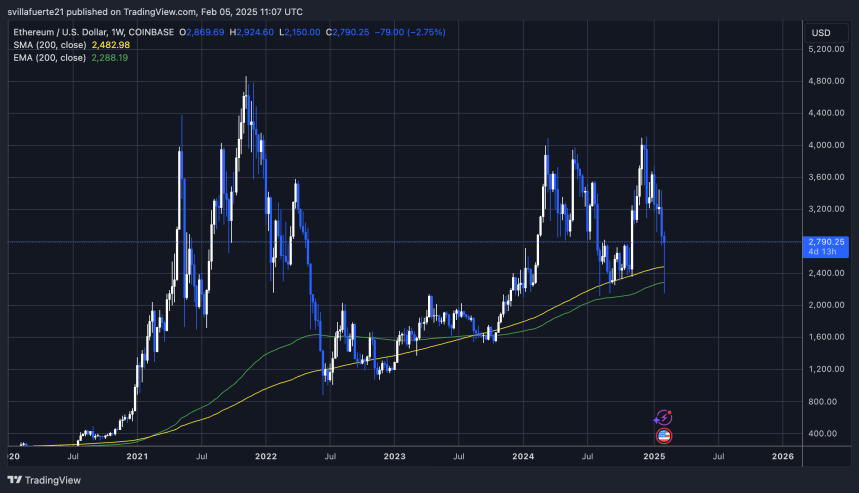
For Ethereum to reverse the short-term bearish trend, bulls must reclaim the $2,800 mark and hold it as support. This level is a psychological and technical barrier that would signal renewed strength. A push above $3,000 is the next critical step, as breaking this resistance would shift sentiment from bearish to bullish and trigger a move into key supply zones.
If Ethereum fails to reclaim these levels, the market could see another wave of selling pressure, pushing ETH back toward lower demand areas. However, historical trends suggest that when ETH holds above these moving averages, it often leads to strong rallies.
Related Reading
Investors are watching closely to see if Ethereum can recover and reestablish its bullish momentum. A breakout above $3,000 would set the stage for a push toward higher resistance levels, potentially leading to a major rally in the coming months.
Featured image from Dall-E, chart from TradingView