
- DOT is now trading within a bullish pattern on the chart, hinting at an incoming price surge
- Technical indicators and market metrics aligned positively with the altcoin’s price
Over the past week, DOT’s price turned bullish on the charts, with the crypto rallying by 12.13% as buying activity intensified. At the time of writing, the altcoin was trading at $5.13, with the crypto noting very minimal losses over the last 24 hours.
According to AMBCrypto’s analysis though, this price drop may be a part of the overall movement needed for a major rally. Especially since the bullish structure has mostly remained intact.
Brief drop before a rally
At press time, Polkadot [DOT] trading within a bullish pattern known as an ascending triangle, formed with a converging support line connected to a horizontal resistance line.
This pattern typically leads to a major rally once the upper resistance level of $5.293 is breached. However, based on the prevailing market structure, DOT could see a brief drop to the support level of $5.085, before a major rally in the next few days.
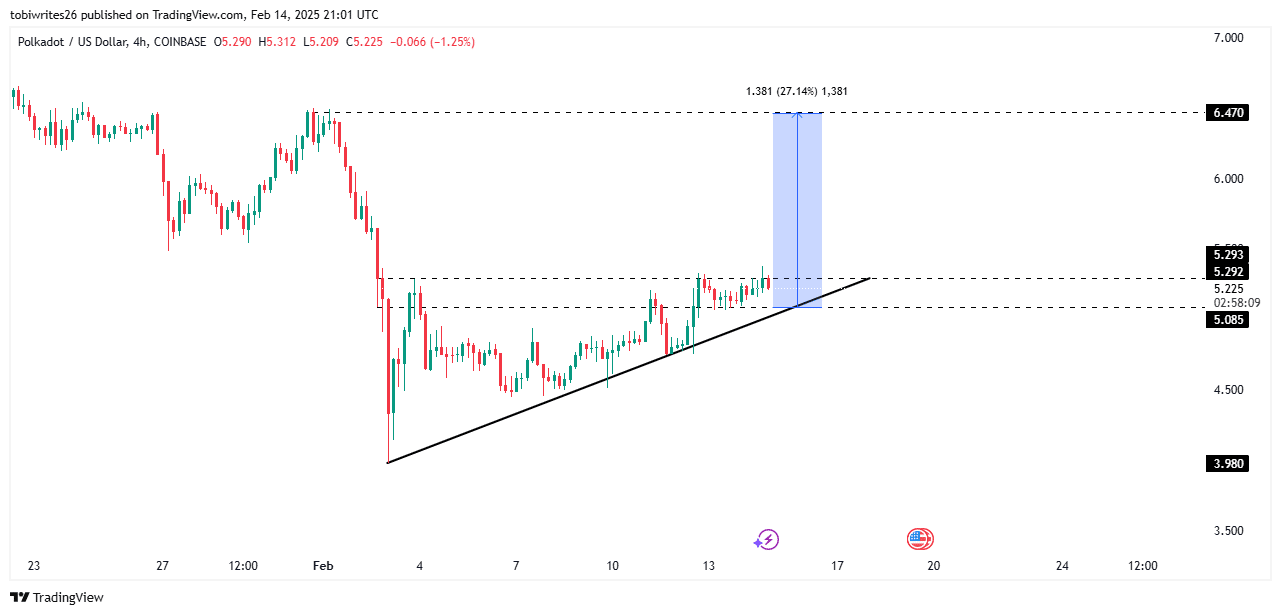
Source: TradingView
This drop to the lower support level is part of DOT’s momentum-building phase ahead of a breakout. Once completed, the asset would likely rally by 27.14%, hitting $6.47, as indicated on the chart.
Accumulation is ongoing
According to the Bull Bear Power (BBP) indicator, which highlights which market segment—buyers or sellers—is in control, buyers are currently dominant.
This was evidenced by the histogram’s formation on the chart. When the histogram is green and above the zero line, it alludes to bullish dominance. Conversely, when it turns red and falls below zero, sellers are more active.
Press time data revealed that the BBP had a press time reading of 0.010 – A sign that buyers are still in control.
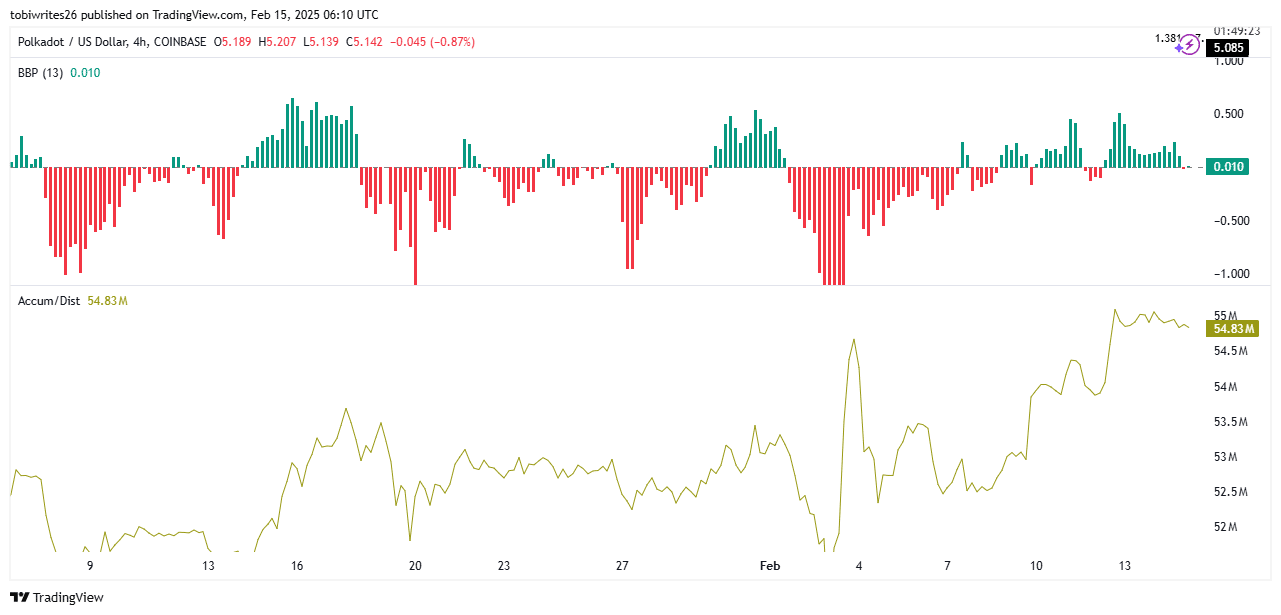
Source: TradingView
A closer look at the Accumulation/Distribution (A/D) metric revealed that it has remained flat, with a reading of 54.83 million. In cases like these, particularly with the A/D staying positive, ongoing buying activity among market participants is a sign of accumulation at a lower price.
The resultant effect would be a price rally once accumulation is complete.
Derivative traders are making long bets
Derivative traders are starting to place long bets, with both the funding rate and the Open Interest-weighted (OI-weighted) funding rate turning positive.
At the time of writing, the funding rate was 0.0050%, meaning buyers have been paying a premium to maintain their positions – A sign of high conviction in the asset.
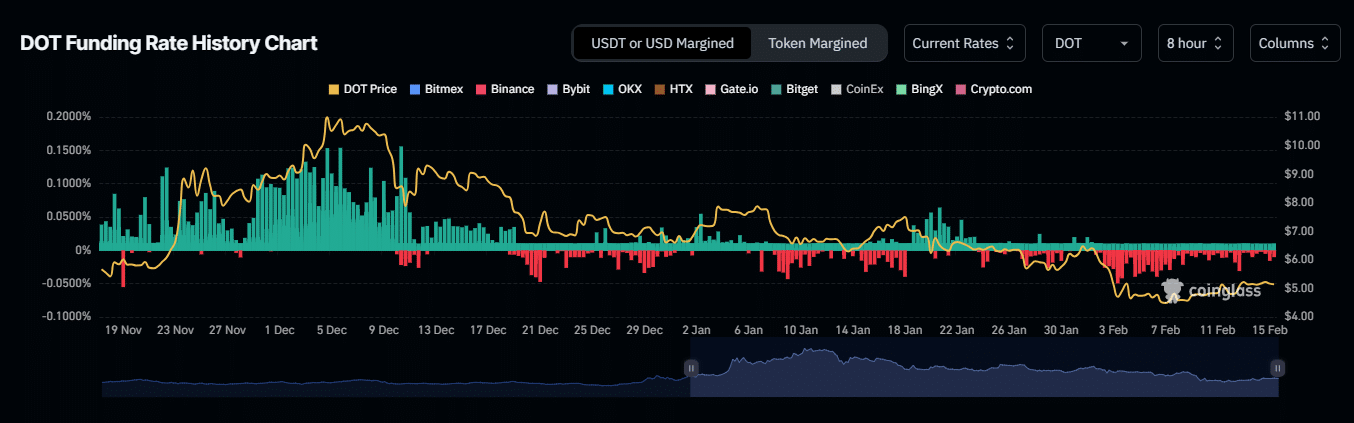
Source: Coinglass
This bullish sentiment can be further confirmed by the OI-weighted funding rate, which has turned positive and has been trending higher. This metric provides a more accurate representation of market sentiment by incorporating Open Interest (OI) into the funding rate calculation.
When it turns positive, as seen with DOT at 0.0021%, it means that buyers are in control and the market could likely follow in that direction.