
- QNT breaks resistance and surges 15.29%, with bulls targeting the $135–$140 price range.
- Open Interest jumps 23.98% to $13.47M, signaling strong trader confidence and bullish momentum.
Quant [QNT] has successfully broken out of a long-term downtrend, signaling a potential rally toward the $135–$140 range.
At the time of writing, QNT was trading at $106.15, marking a 15.29% daily increase and a 10.65% rise over the past week. With a circulating supply of 15 million QNT, the token holds a market capitalization of $1.50 billion.
Key levels and price action
At press time, Quant’s price chart showed a clear breakout from a descending trendline that had been in place since December 2023.
This breakout indicated a shift in market sentiment, as buyers pushed QNT toward higher resistance levels.
With this breakout confirmed, the next resistance zone lies between $135 and $140, a historically significant level. If buying momentum continues, QNT could test these levels in the coming days.
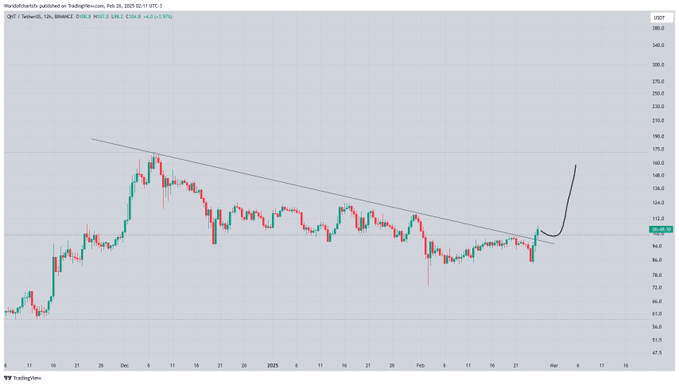
Source: X
On the downside, if QNT fails to hold above the breakout zone, the previous resistance at $95–$100 will act as key support.
Holding this level would confirm the breakout’s validity, while a drop below could lead to further consolidation.
Strengthening momentum ahead
Technical indicators suggest that QNT’s bullish momentum was gaining traction. The Relative Strength Index (RSI) was at 59.68, nearing bullish territory but was not yet in the overbought zone.
If RSI moves above 70, it could indicate resistance, potentially leading to a short-term pullback.
The MACD line at 1.56 has crossed above the signal line at -0.08, forming a bullish crossover. Additionally, the MACD histogram turned positive, reflecting increasing buying pressure.
If this trend continues, QNT could maintain its upward trajectory, further confirming the breakout’s strength.
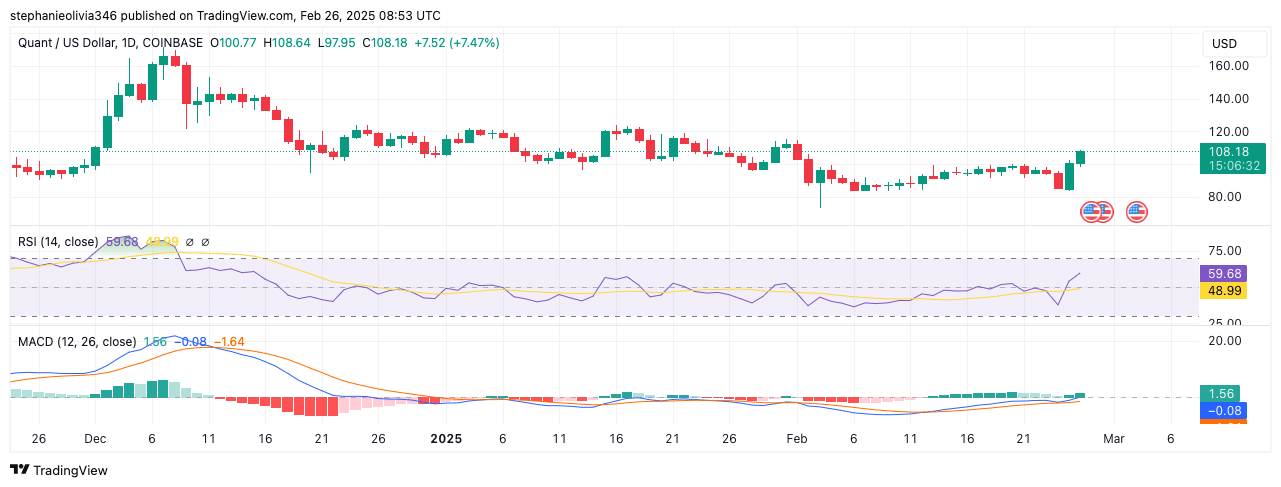
Source: TradingView
Futures market and spot activity
According to Coinglass data, QNT’s Open Interest surged 23.98% to $13.47M, indicating rising trader participation. Historical data suggested that OI spikes above $30M in December and April led to higher price volatility.
If Open Interest continues to rise, QNT could see further price movement, potentially testing higher resistance levels.
Additionally, QNT spot netflow surged to $2.35M on the 26th of February, reflecting a strong inflow of assets into exchanges. This could indicate potential selling pressure, as traders may be preparing to offload holdings.
However, if market demand absorbs the inflow, QNT could sustain its bullish momentum and continue its upward move.
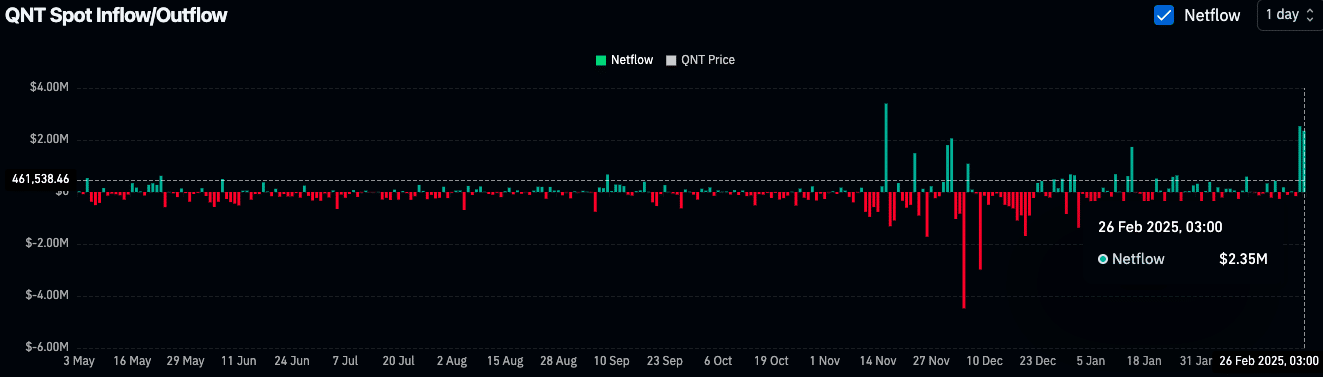
Source: Coinglass
Can QNT sustain its bullish run?
With growing Open Interest, rising trading volume, and bullish technical signals, QNT appears to be in a strong position for further gains. If momentum holds, a move toward the $135–$140 resistance zone remains likely.
Traders will closely monitor volume trends, RSI levels, and price action to assess whether QNT can maintain its upward trajectory or enter a consolidation phase.