
Bitcoin’s downward trajectory continues, with its price slipping below $89,000, marking an 8.5% loss over the past week. This extended decline has raised concerns among investors about whether the bottom is finally in.
Recent market behavior suggests that significant capitulation is taking place, which some analysts believe could indicate a turning point.
Massive Bitcoin Sell-Off: Is The Bottom In?
A key observation has emerged from a CryptoQuant analyst known as caueconomy, who recently highlighted what he describes as the “largest Bitcoin capitulation” event of 2025.
In a post titled “The biggest Bitcoin capitulation since August 2024 – bottom is in?,” caueconomy noted that more than 79,000 BTCs were sold at a loss within a single day, amounting to roughly $1.7 billion.
This sell-off, according to caueconomy, is reminiscent of the capitulation event in August 2024, when Japan’s interest rate hikes triggered widespread deleveraging across global markets.
Caueconomy’s analysis points to a critical juncture for Bitcoin. He observed that the previous capitulation event in August 2024 marked a short-term bottom, as the market stabilized and eventually rallied to $100,000 by December.
While he acknowledges that it’s impossible to guarantee the current price won’t drop further, the scale of this capitulation presents a potential opportunity for long-term investors.
The analyst’s insights offer a mixed picture: although the market may face continued pressure, the extent of recent selling activity could indicate that many “weak hands” have been shaken out.
This process, while painful in the short term, often sets the stage for a more solid price foundation, enabling a recovery down the line.
The biggest Bitcoin capitulation since August 2024 – bottom is in?
“A total of more than US$ 1.7 billion in coins were distributed at a loss on the 25th, being the biggest capitulation since August 5th.” – By @caueconomy
Read more
https://t.co/gclTPwRqgr pic.twitter.com/sxmF2tw79r
— CryptoQuant.com (@cryptoquant_com) February 26, 2025
Ongoing Bearish Indicators Persist
Despite these observations, other analysts remain cautious about calling a market bottom. In another analysis shared on CryptoQuant’s platform, an analyst known as Nino highlighted several bearish indicators that have surfaced in recent weeks.
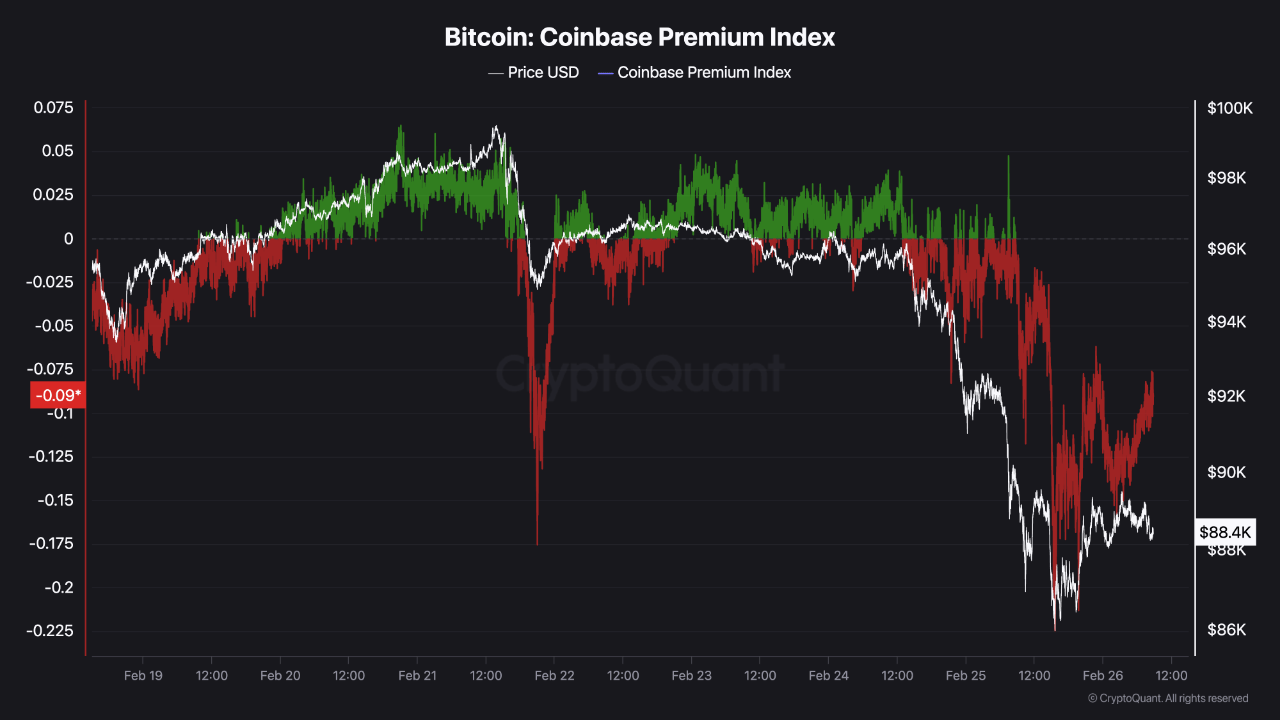
Negative funding rates on various derivatives exchanges, combined with a negative Coinbase Premium, suggest a continued dominance of short positions and heightened selling pressure in the spot market.
Nino explained that when funding rates are negative, futures prices are trading below spot prices, reflecting an increase in short interest. Simultaneously, a negative Coinbase Premium indicates that selling on Coinbase has been substantial enough to push its spot price below that of other exchanges.
The CryptoQuant analyst added:
These figures together highlight a strong bearish sentiment among market participants, with short-selling pressure outpacing that of long positions in this recent downturn. All of these findings are strictly based on what can be observed from the chart, offering a glimpse into the overall market mood.

Featured image created with DALL-E, Chart from TradingView