
- BONK’s breakout beyond $0.0140 could trigger liquidations, driving prices toward $0.0150.
- The 24-hour liquidation heatmap on Binance identified critical liquidity clusters.
Bonk’s [BONK] recent price action has drawn attention, as it attempted a breakout from a prolonged downtrend.
The price surge, technical shifts, and liquidity patterns suggested a possible trend reversal, but market stability remained uncertain.
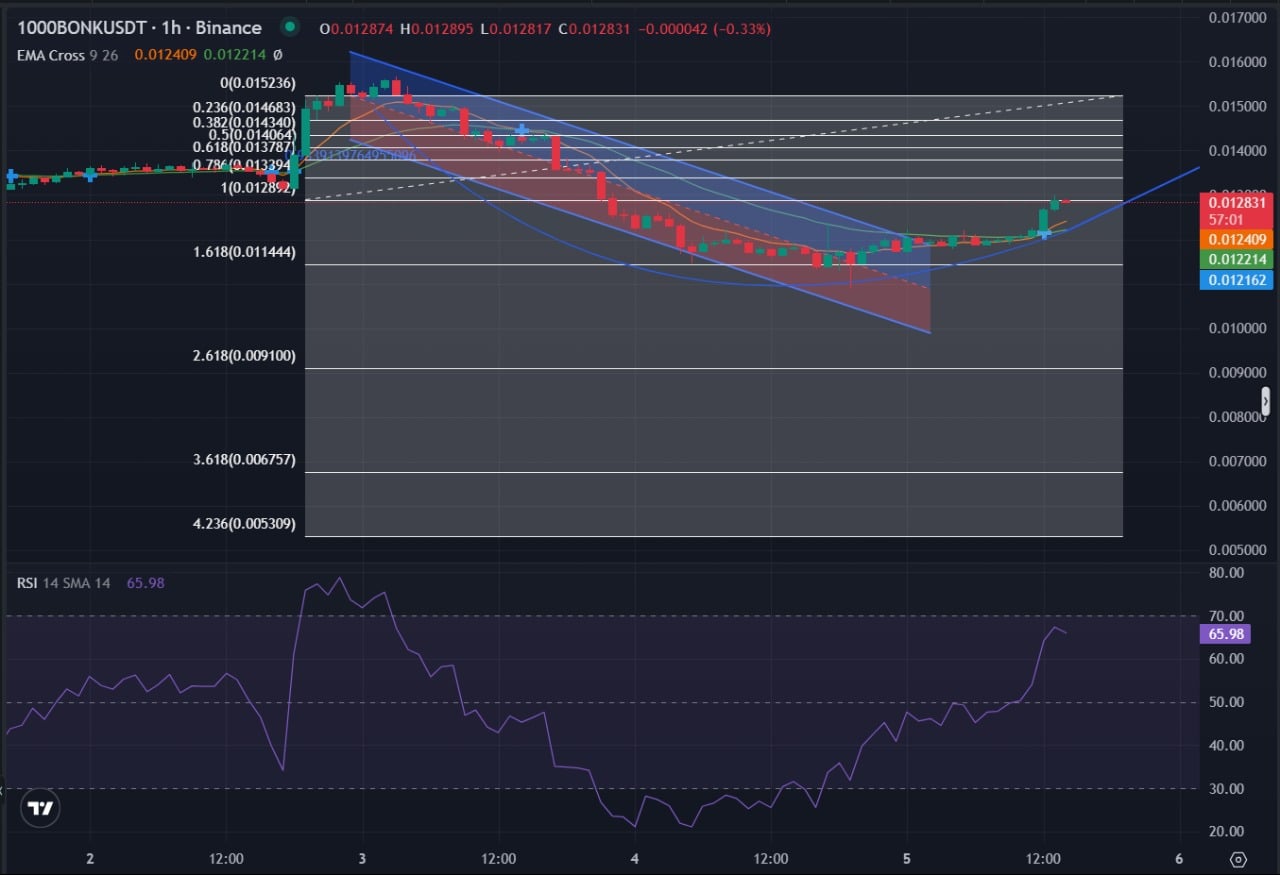
The 1-hour price chart showed a significant break from a descending trendline, with BONK rising to $0.012594 after bouncing off the Fibonacci retracement support at $0.011603.
This level acted as a critical base, setting the stage for a potential rally toward $0.014706 resistance. The 9-day and 26-day EMA crossover, at $0.012145 and $0.012102, signaled a bullish reversal amid recent volatility.
Source: Coinglass
Momentum indicators reinforced this shift. The RSI at 65.98, positioned above the neutral 50 level but below 70, indicated strong momentum while cautioning against overextension.
If BONK sustains above $0.012102, it could test $0.014706, potentially sparking a broader uptrend. However, a drop below $0.011603 might invalidate the breakout, resuming the downtrend.
Similar past breakouts at Fibonacci levels supported rallies, highlighting the importance of volume confirmation.
BONK stability or market shake up?
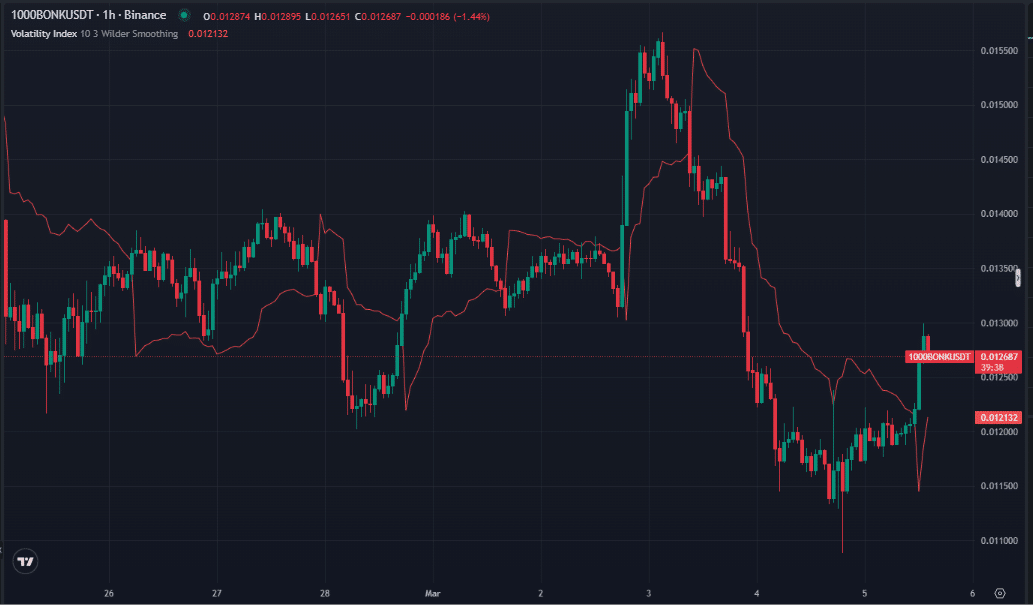
The 1-hour BONK/USD chart displayed a Volatility Index of 0.012132. The price, at 0.012687, fell 1.44%, indicating heightened volatility.
This level suggested market instability, with the index fluctuating between 0.011000 and 0.015000.
Source: Coinglass
Also, peaks above 0.014000 signaled extreme volatility, while dips below 0.012000 indicated calmer periods, as seen on March 2–5, 2025.
This instability could undermine BONK’s upward momentum, triggering sharp sell-offs if volatility spiked above 0.015000.
Conversely, stabilization below 0.012000 might support recovery, fostering trader confidence. Deeper analyses noted this pattern in prior cycles, where high volatility preceded corrections.
BONK’s current state warned of risks, but a return to lower volatility offered growth potential.
Identifying key price levels
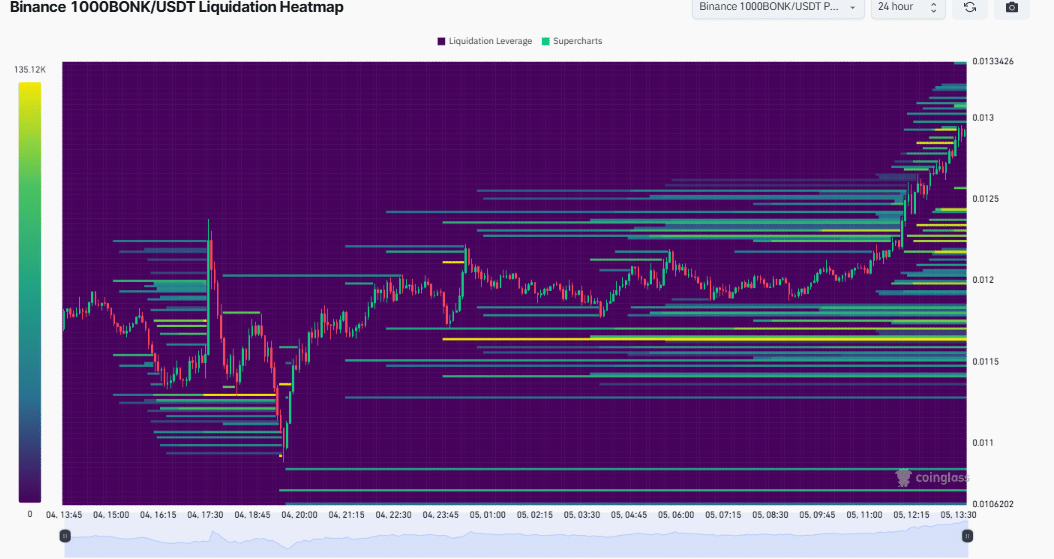
BONK’s 24-hour liquidation heatmap on Binance identified critical liquidity clusters.
The price, at $0.013242 at press time, faced dense liquidation zones at $0.0125, $0.0130, and $0.0140, where large long and short positions accumulated.
Source: Liquidation Heatmap
These liquidity zones, spanning $0.0110 to $0.0150, signaled potential volatility if broken, with leverage up to 125x amplifying risks.
A breakout beyond $0.0140 could trigger liquidations, driving prices toward $0.0150. Conversely, a dip below $0.0120 might accelerate losses, sending BONK toward $0.0110.
This pattern mirrored past heatmap trends, where liquidity gaps fueled rapid price moves.
Can BONK sustain its rally?
BONK’s break from a descending trendline, EMA crossover at $0.012145 and $0.012102, and RSI at 65.98 suggested bullish momentum.
The volatility index at 16.274 and liquidity clusters at $0.0125–$0.0140 reinforced this outlook but highlighted potential risks.
Recent market buzz on the 5th of March fueled speculation about BONK’s memecoin potential, with increasing community engagement and exchange activity driving price action.
If BONK holds $0.011603 support and surpasses $0.014706, it could rally toward $0.0160, capitalizing on memecoin enthusiasm.
However, a drop below $0.0110 could trigger a bearish phase, with prices potentially testing $0.0100.
Further analysis showed similar patterns in DOGE and SHIB, where retail-driven momentum sustained uptrends.
BONK’s future remains highly dependent on volatility control and liquidity-driven moves, offering high-risk, high-reward opportunities in the evolving altcoin landscape.