Close Menu
    What's Hot

    Shiba Inu’s deflation drive stalls – But before you buy the dip, look out for…

    US Ethereum ETFs Record 4 Consecutive Weeks Of Positive Inflows — Details

    Here’s why Sonic erased $1.3 billion in value

    Facebook X (Twitter) Instagram
    yeek.io
    • Crypto Chart
    • Crypto Price Chart
    X (Twitter) Instagram TikTok
    Trending Topics:
    • Altcoin
    • Bitcoin
    • Blockchain
    • Crypto News
    • DeFi
    • Ethereum
    • Meme Coins
    • NFTs
    • Web 3
    yeek.io
    • Altcoin
    • Bitcoin
    • Blockchain
    • Crypto News
    • DeFi
    • Ethereum
    • Meme Coins
    • NFTs
    • Web 3
    Crypto News

    If This Happens, Bitcoin Price Will Shoot To $140,000, Says Analyst

    Yeek.ioBy Yeek.ioMarch 8, 2025No Comments3 Mins Read
    Share Facebook Twitter Pinterest Copy Link Telegram LinkedIn Tumblr Email
    Share
    Facebook Twitter LinkedIn Pinterest Email

    Reason to trust

    Strict editorial policy that focuses on accuracy, relevance, and impartiality

    Created by industry experts and meticulously reviewed

    The highest standards in reporting and publishing

    Strict editorial policy that focuses on accuracy, relevance, and impartiality

    Morbi pretium leo et nisl aliquam mollis. Quisque arcu lorem, ultricies quis pellentesque nec, ullamcorper eu odio.


    Este artículo también está disponible en español.

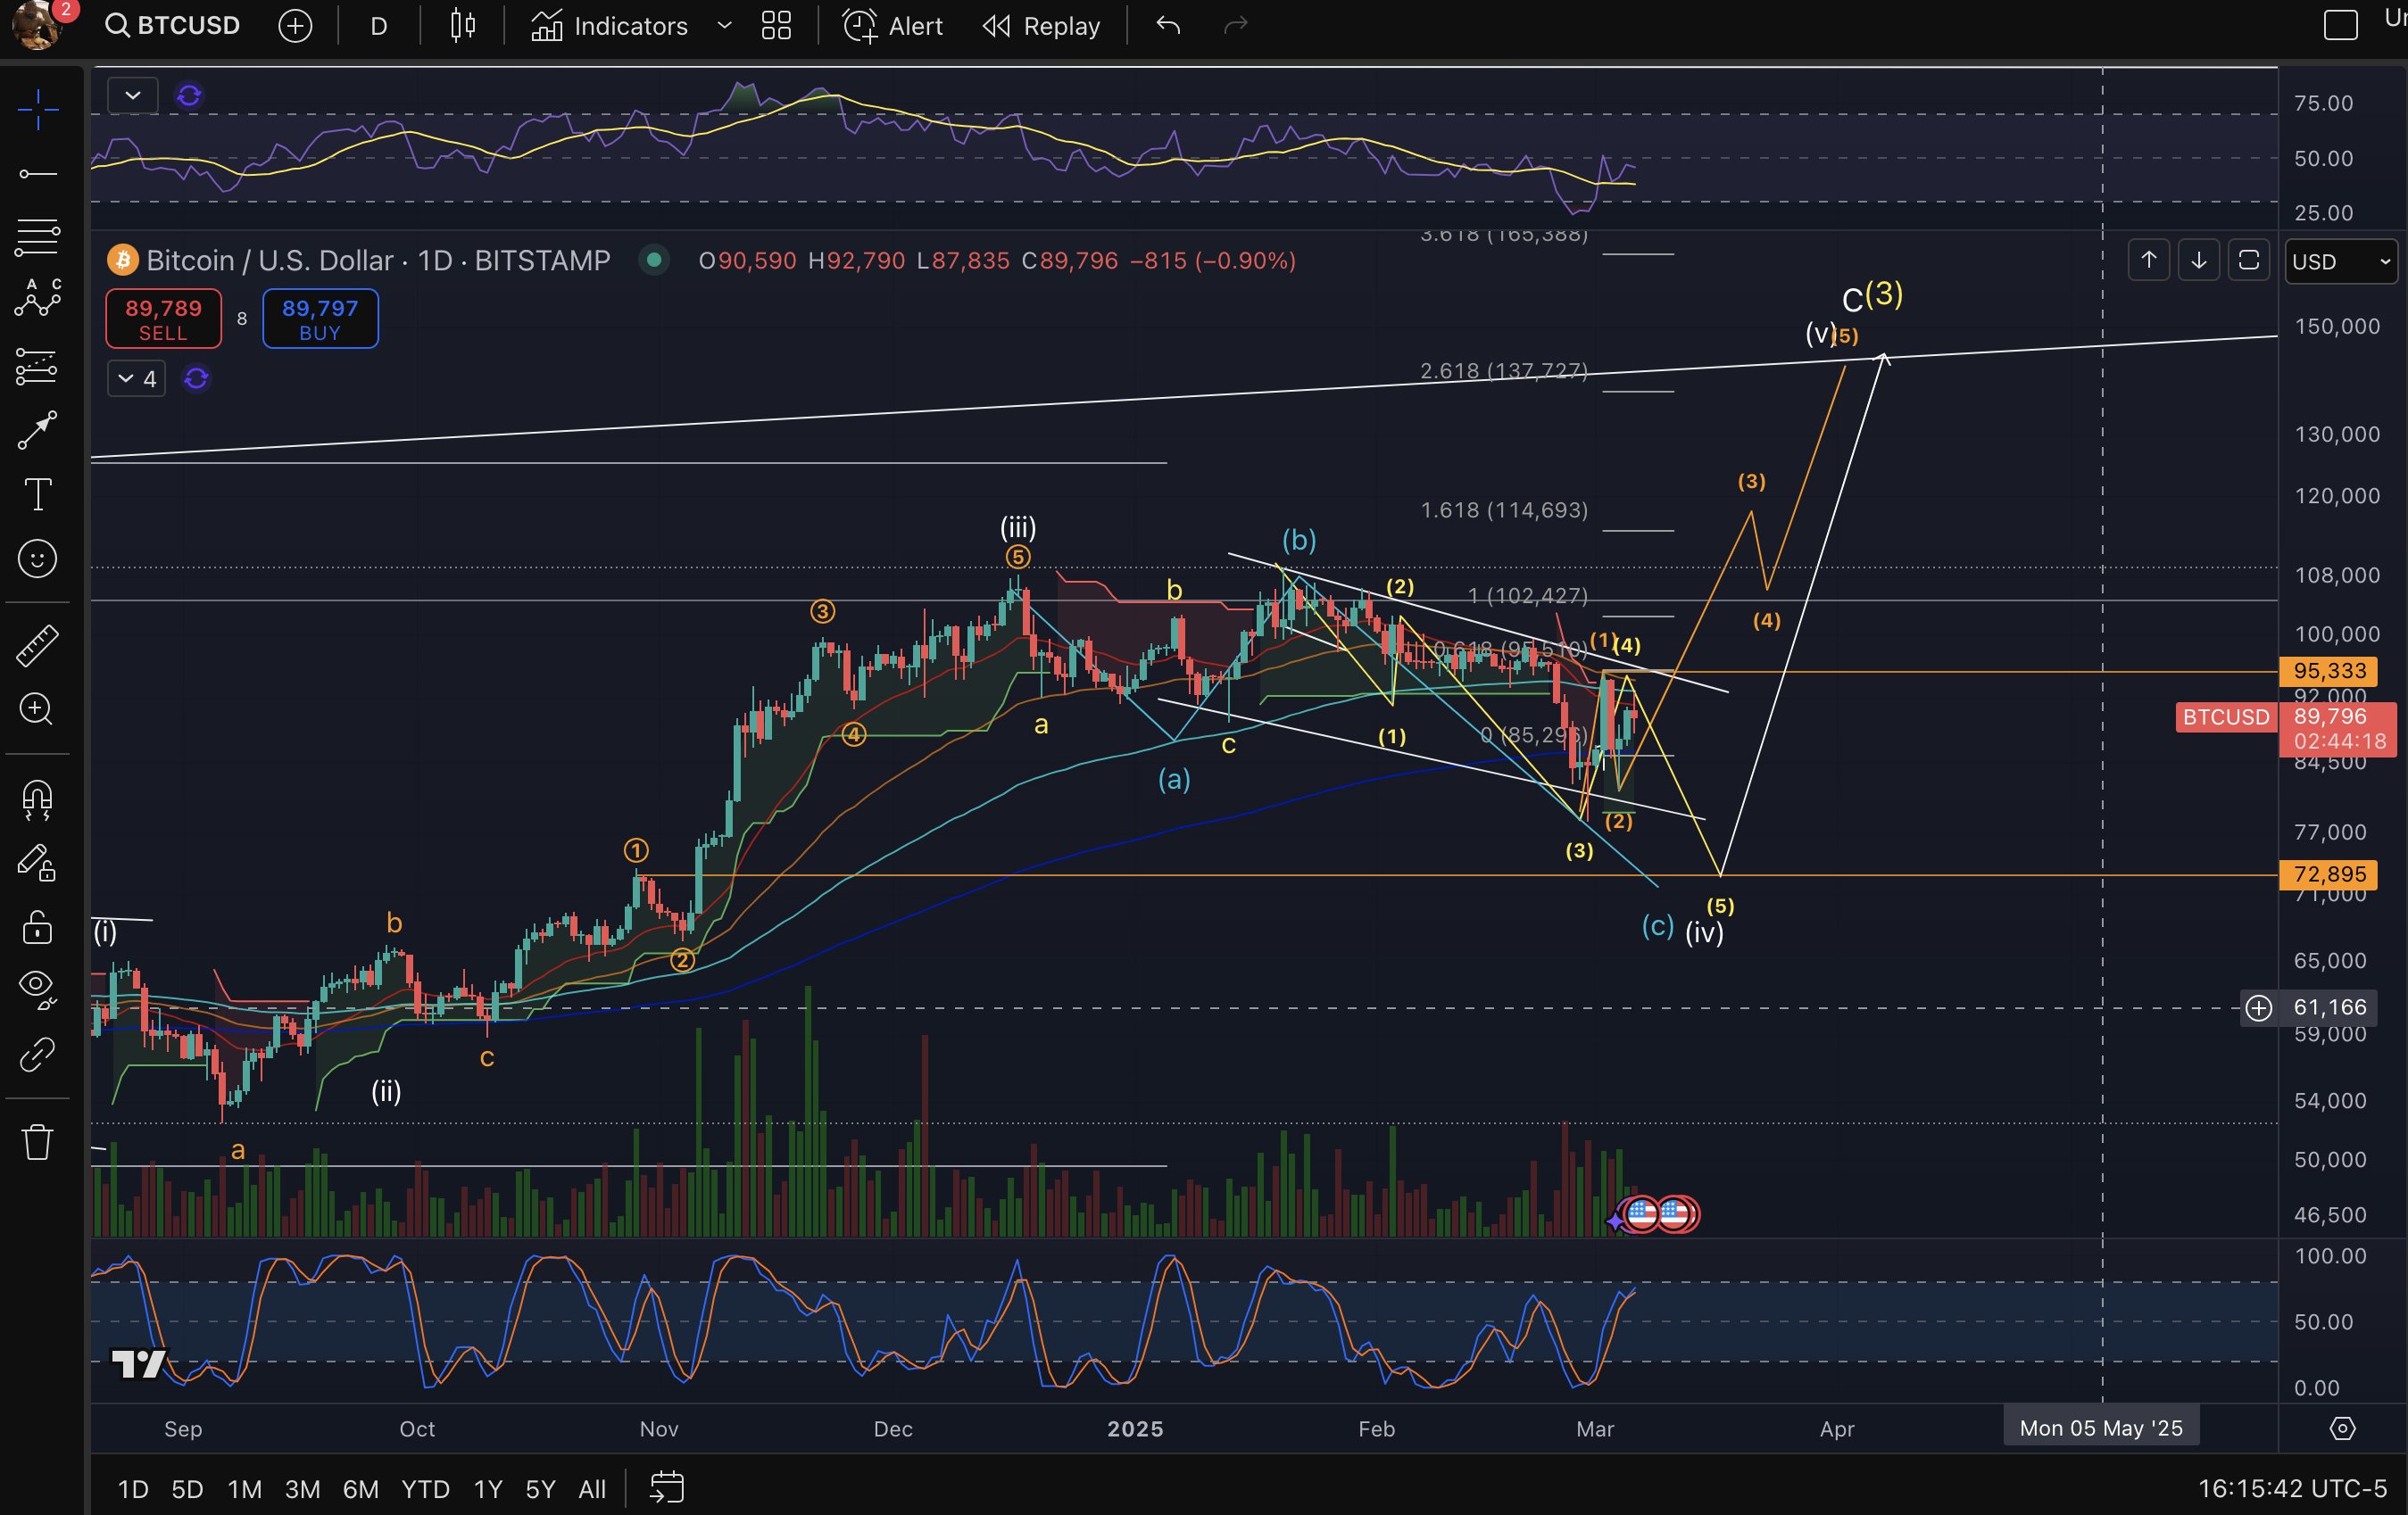
    In a newly published chart, Elliott Wave specialist and crypto analyst Big Mike (@Michael_EWpro) outlines a precise roadmap for Bitcoin’s price action, indicating that a break above $95,000—or a bounce from lower support near $72,895—could propel BTC toward the $130,000–$140,000 region. His analysis builds on detailed wave counts, multiple Fibonacci extension targets, and critical moving averages, offering a granular look at the BTC’s near- and mid-term possibilities.

    What’s Next For Bitcoin?

    Big Mike’s chart displays a complex Elliott Wave structure consisting of five main impulse waves and interspersed corrective sub-waves. A key area labeled near $72,895 corresponds to wave (c)(iv), representing a major potential bottom if the market breaks below $78,000 and continues lower.
    Bitcoin price analysis
    Bitcoin price analysis, 1-day chart | Source: X @Michael_EWpro

    Notable corrective waves around $85,000 to $95,000 appear to have formed a larger consolidation phase, which he regards as a precursor to the next directional move. The chart also pinpoints an upside pathway from roughly $95,000, projecting impulse waves (3), (4), and (5) that extend into the $100,000–$140,000 zone.

    Related Reading

    Fibonacci extension targets appear at approximately $114,693 (1.618 extension) which could be the target for wave (3), followed by a corrective move to $102,000 before starting wave 5 which aims for $137,727 (2.618 extension), or even a final leg near $150,000 aligns with wave c(3).

    Moving averages in the $72,000–$90,000 range underscore the significance of support near $78,000–$72,895, while an upper band around $90,000–$95,000 represents a crucial resistance corridor. The analyst observes a descending wedge formation from mid-February to early March, spanning $95,000 down to $85,000, and notes that an upside breakout could herald a renewed push into six-figure territory.

    Related Reading

    Volume profiles indicate subdued participation during recent corrective phases, alongside a neutral Stochastic RSI reading that suggests momentum could shift decisively depending on which price threshold gives way first.

    Big Mike emphasizes two critical lines in the sand: “BTC above $95k will trigger the move quickly towards my target of $130-$140k. Below $78k and we test $72k, then run to $140k.” From his perspective, both a direct break above $95,000 and a deeper dip to $72,895 ultimately converge on the same upside target near $130,000–$140,000.

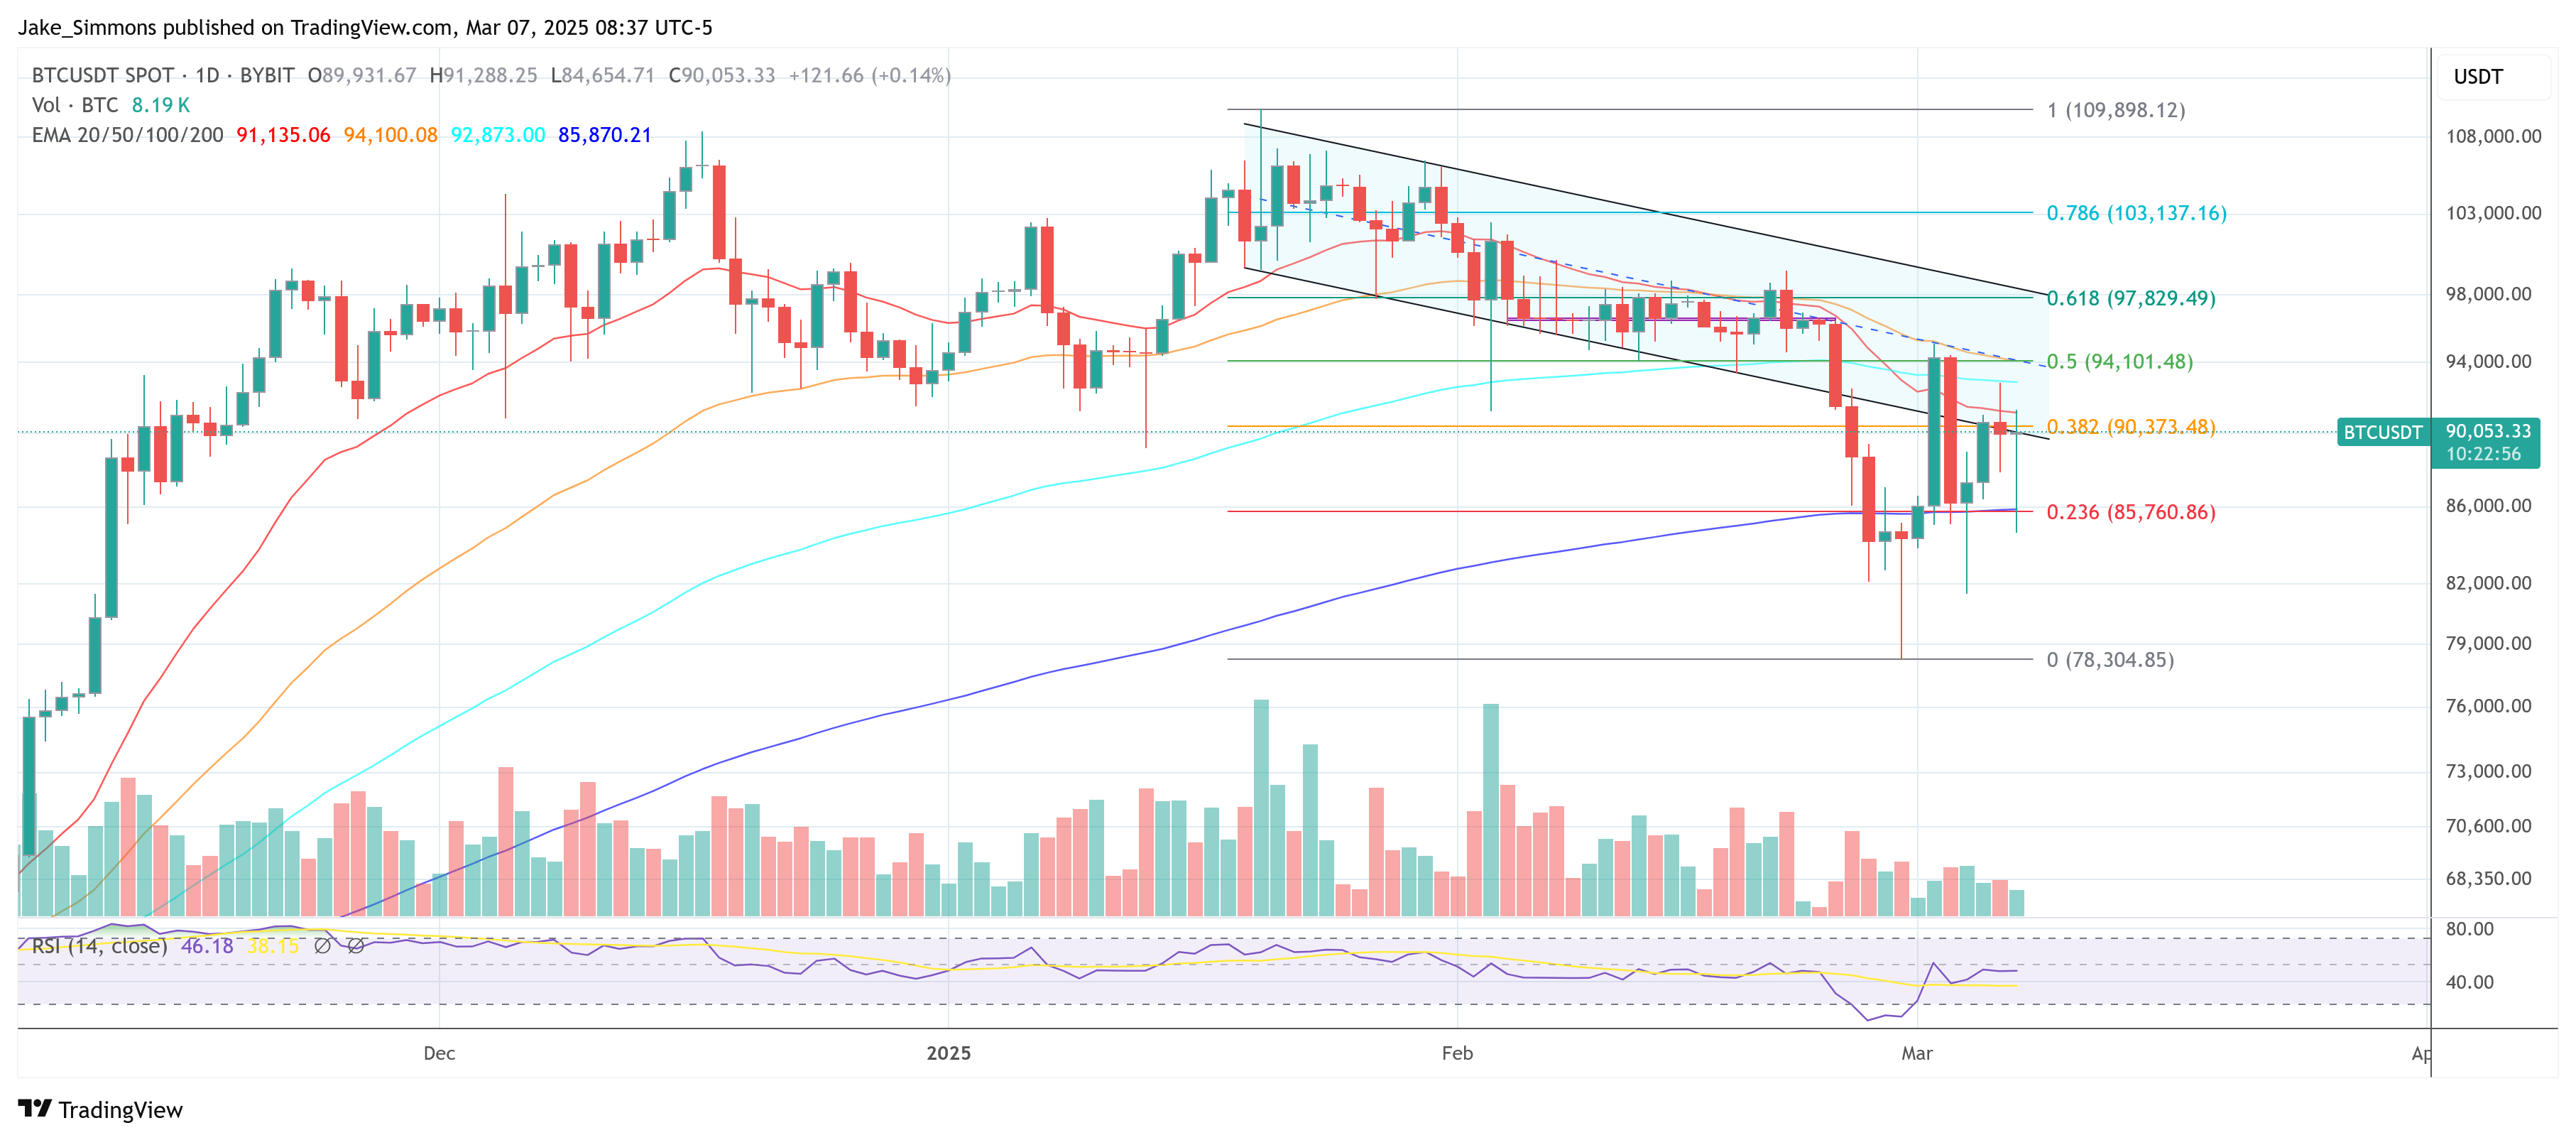
    At press time, BTC traded at $90,053.
    Bitcoin price
    BTC price hovers below key resistance, 1-day chart | Source: BTCUSDT on TradingView.com

    Featured image created with DALL.E, chart from TradingView.com

    Follow on Google News Follow on Flipboard
    Share. Facebook Twitter Pinterest LinkedIn Tumblr Email Copy Link
    Previous ArticleHighest ROI Crypto: Arctic Pablo Coin, Filecoin, and Cosmos
    Next Article Why Bitcoin dropped following the US BTC reserve launch?
    Avatar
    Yeek.io
    • Website

    Yeek.io is your trusted source for the latest cryptocurrency news, market updates, and blockchain insights. Stay informed with real-time updates, expert analysis, and comprehensive guides to navigate the dynamic world of crypto.

    Related Posts

    Darkweb actors claim to have over 100K of Gemini, Binance user info

    March 28, 2025

    Ethereum Sentiment Dips Among Retail Investors, Yet A Breakout Looms

    March 28, 2025

    ‘Our GPUs are melting’ — OpenAI puts limiter in after Ghibli-tsunami

    March 28, 2025
    Leave A Reply Cancel Reply

    Advertisement
    Demo
    Latest Posts

    Shiba Inu’s deflation drive stalls – But before you buy the dip, look out for…

    US Ethereum ETFs Record 4 Consecutive Weeks Of Positive Inflows — Details

    Here’s why Sonic erased $1.3 billion in value

    Whales lose SYRUP sweet tooth despite Maple Finance’s growth

    Popular Posts
    Advertisement
    Demo
    X (Twitter) TikTok Instagram

    Categories

    • Altcoin
    • Bitcoin
    • Blockchain
    • Crypto News

    Categories

    • Defi
    • Ethereum
    • Meme Coins
    • Nfts

    Quick Links

    • Home
    • About
    • Contact
    • Privacy Policy

    Important Links

    • Crypto Chart
    • Crypto Price Chart
    © 2025 Yeek. All Copyright Reserved

    Type above and press Enter to search. Press Esc to cancel.