Close Menu
    What's Hot

    US Ethereum ETFs Record 4 Consecutive Weeks Of Positive Inflows — Details

    Here’s why Sonic erased $1.3 billion in value

    Whales lose SYRUP sweet tooth despite Maple Finance’s growth

    Facebook X (Twitter) Instagram
    yeek.io
    • Crypto Chart
    • Crypto Price Chart
    X (Twitter) Instagram TikTok
    Trending Topics:
    • Altcoin
    • Bitcoin
    • Blockchain
    • Crypto News
    • DeFi
    • Ethereum
    • Meme Coins
    • NFTs
    • Web 3
    yeek.io
    • Altcoin
    • Bitcoin
    • Blockchain
    • Crypto News
    • DeFi
    • Ethereum
    • Meme Coins
    • NFTs
    • Web 3
    Altcoin

    Stablecoin dominance to fall once again? Impact on Bitcoin’s market will be…

    Yeek.ioBy Yeek.ioMarch 8, 2025No Comments3 Mins Read
    Share Facebook Twitter Pinterest Copy Link Telegram LinkedIn Tumblr Email
    Share
    Facebook Twitter LinkedIn Pinterest Email
    • Stablecoin exchange reserves highlighted rising buying power in the market
    • Bitcoin’s dominance chart suggested the market could favor BTC in the coming weeks

    Tether [USDT] and USD Coin [USDC] are the largest stablecoins by market capitalization right now. In fact, their combined dominance stood at 7.19% at press time. The dominance trends of Bitcoin [BTC] or stablecoins can shed light on market-wide sentiment and what the future price movements could be.

    Hence, the question – What can we find out from their metrics, and how does it combine with the BTC dominance chart to give actionable insights for traders?

    Stablecoin and Bitcoin dominance metrics show altcoins could be set to suffer more

    Stablecoins Dominance

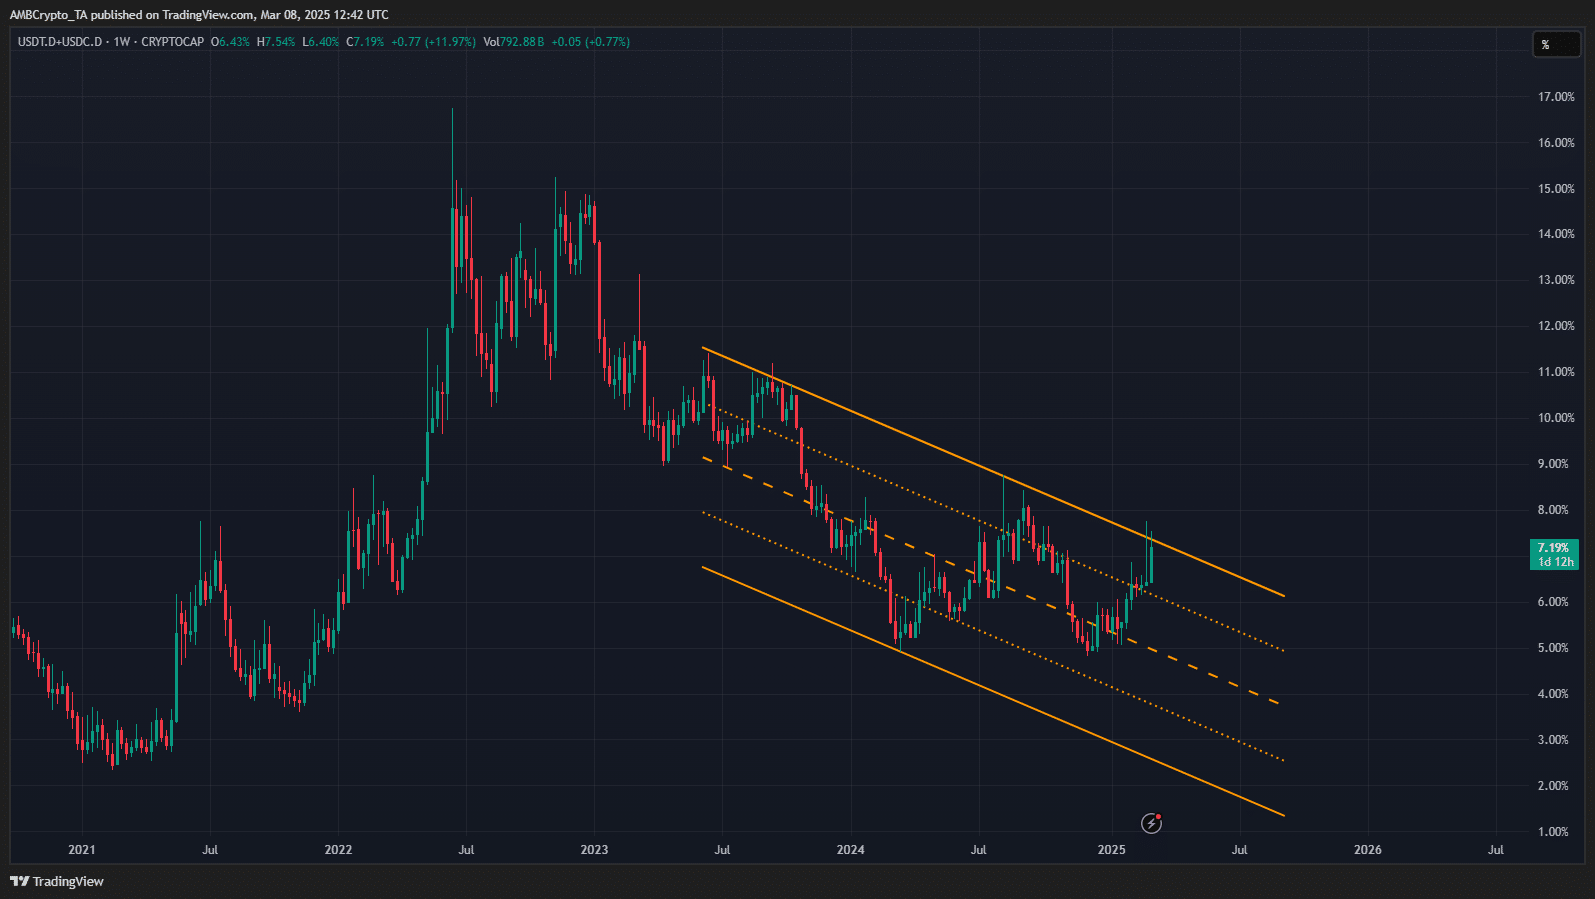
    Source: USDT.D+USDC.D on TradingView

    The combined dominance of Tether and USD Coin have been moving within a descending channel on the 1-week chart, plotted in orange. The movement of the stablecoin dominance can be inversely related to crypto prices. Higher stablecoin dominance implies investors prefer to hold stables, instead of altcoins or Bitcoin.

    Conversely, a fall in dominance from USDT and USDC would imply investors’ capital is pouring into other assets, driving their prices higher and indicating a more bullish market setting.

    In the aforementioned chart, the descending channel formation meant the dominance would soon fall. A breakout is possible, but unlikely, as this channel has been respected since July 2023. A fall in stablecoins’ dominance could see an uptrend for Bitcoin, and potentially many altcoins too.
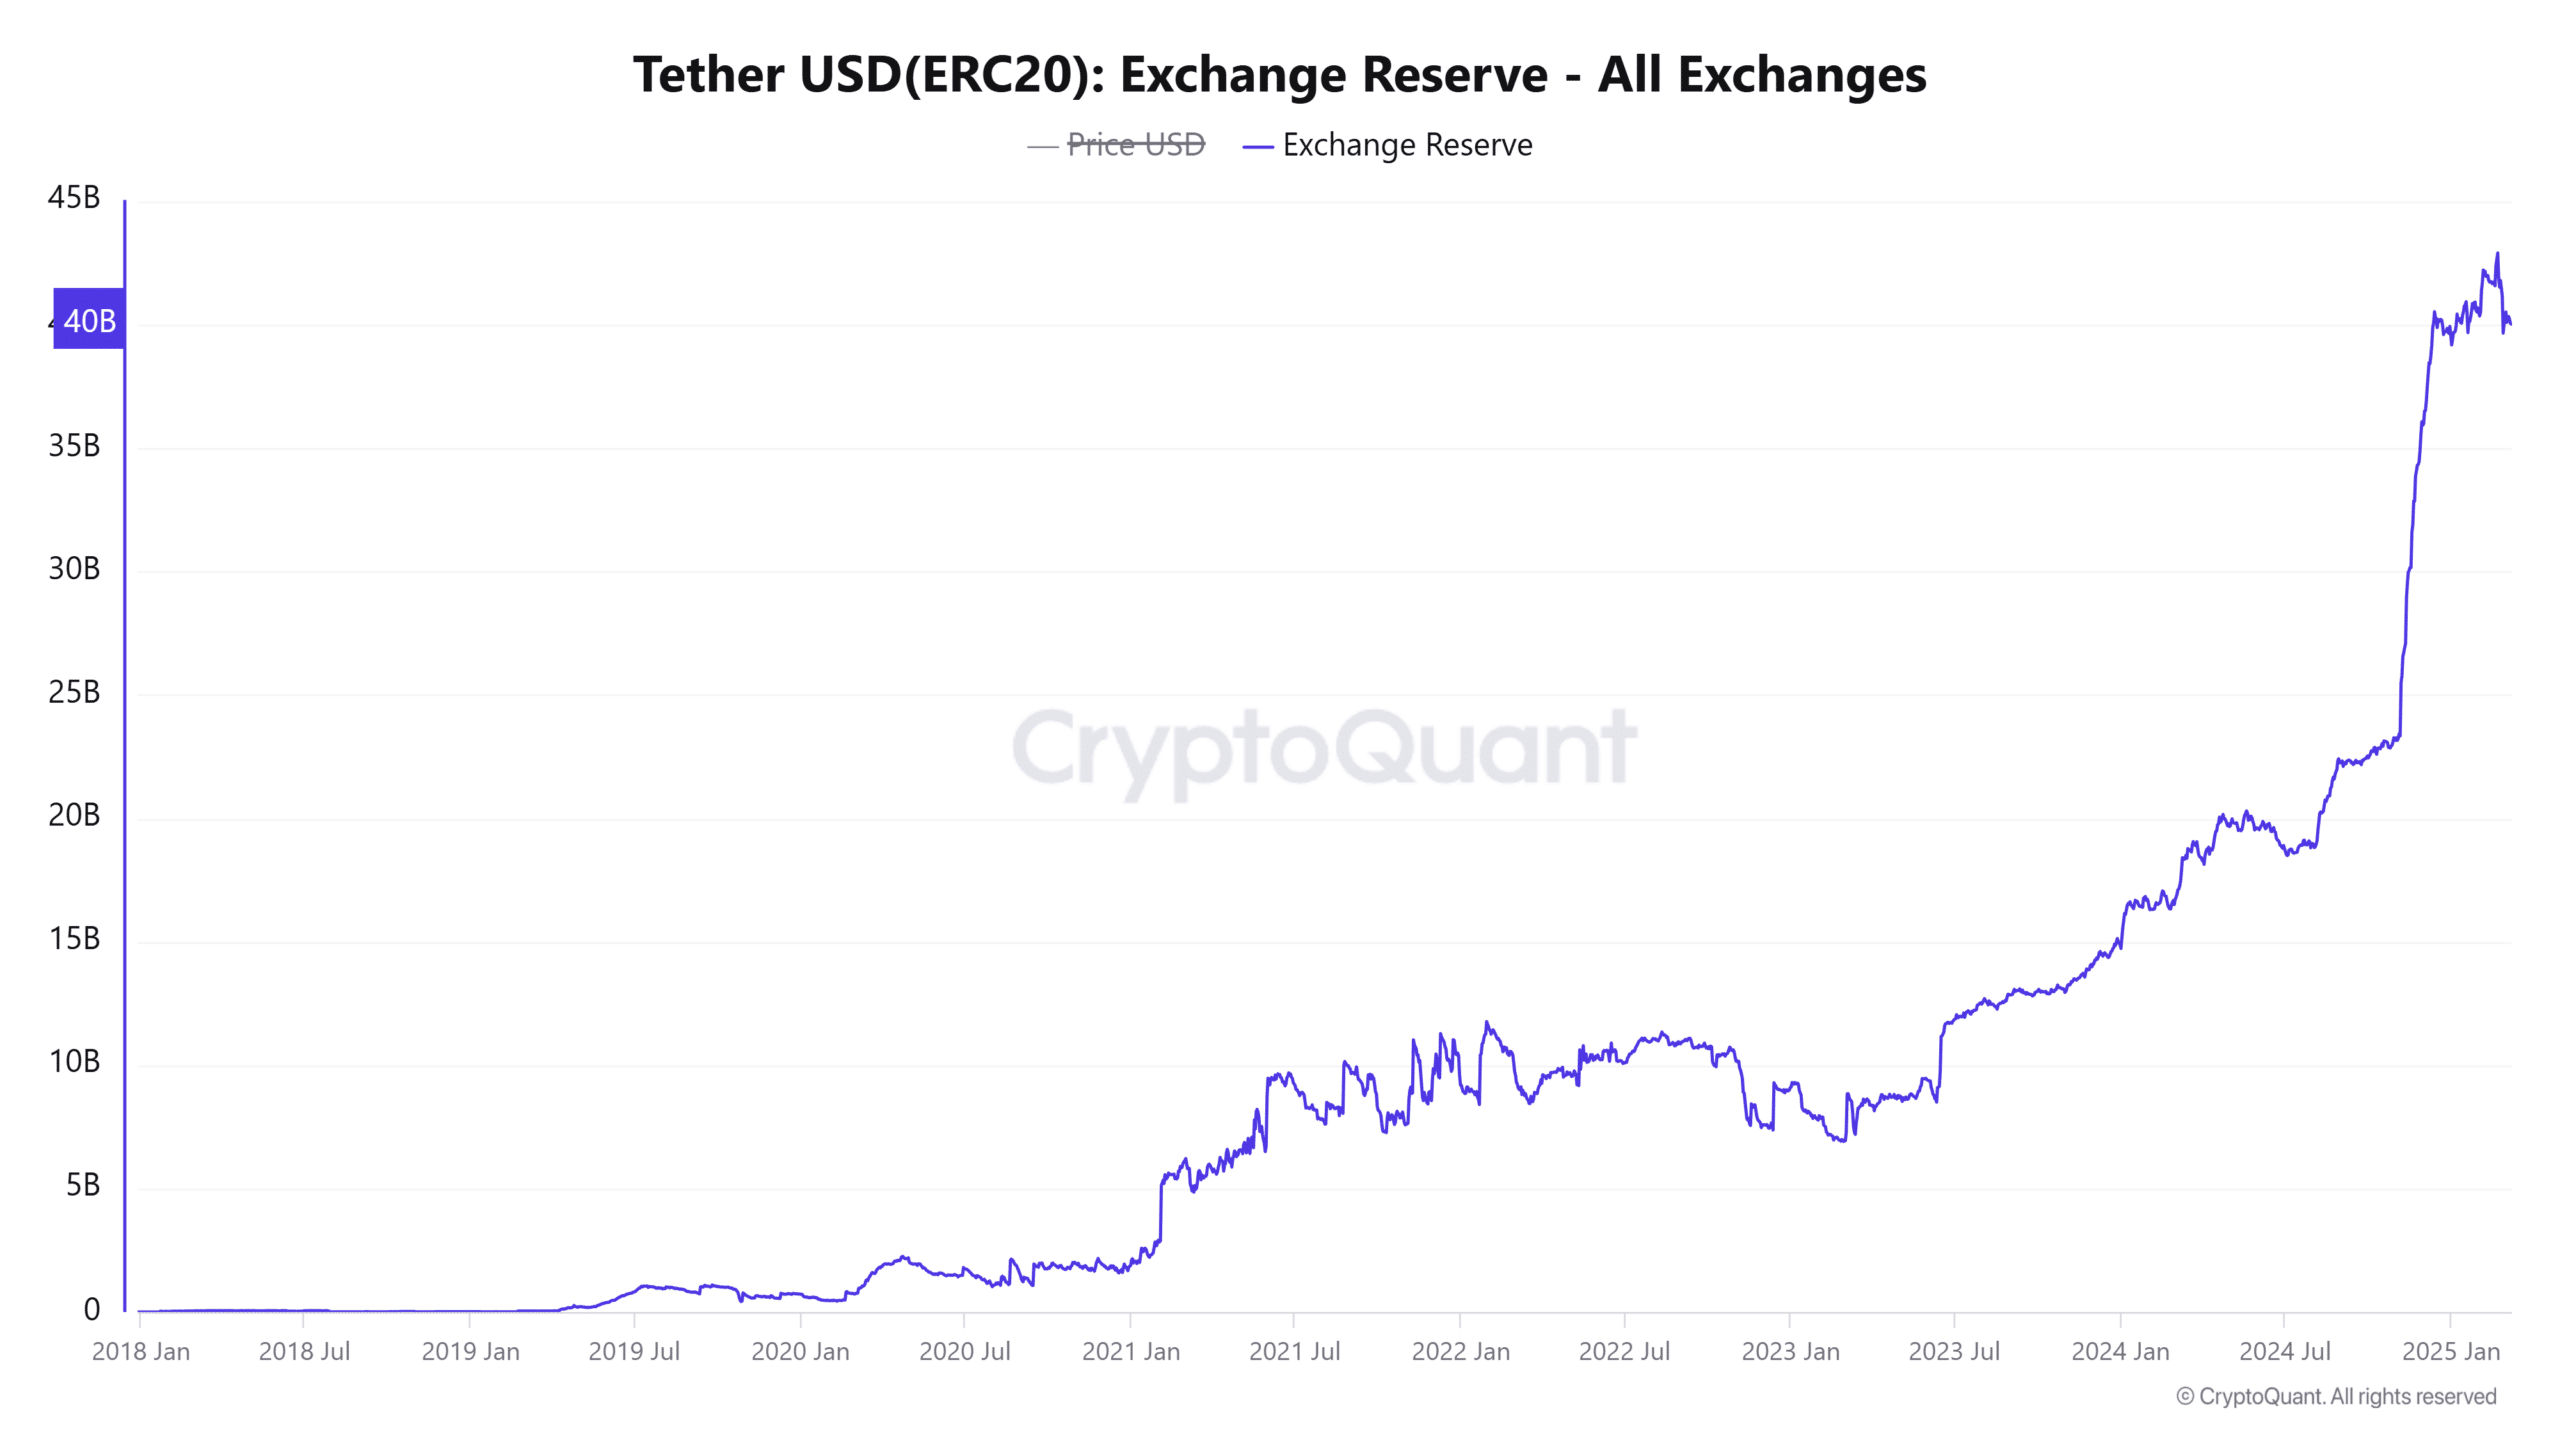
    USDT Exchange ReserveUSDT Exchange Reserve

    Source: CryptoQuant

    Generally, a crypto asset’s rising exchange reserves would imply heightened chances of selling pressure.

    However, a hike in USDT reserves on centralized exchanges implies heightened buying power. In fact, their trend has been pointing higher over the past 18 months, with rapid growth seen especially in November 2024.
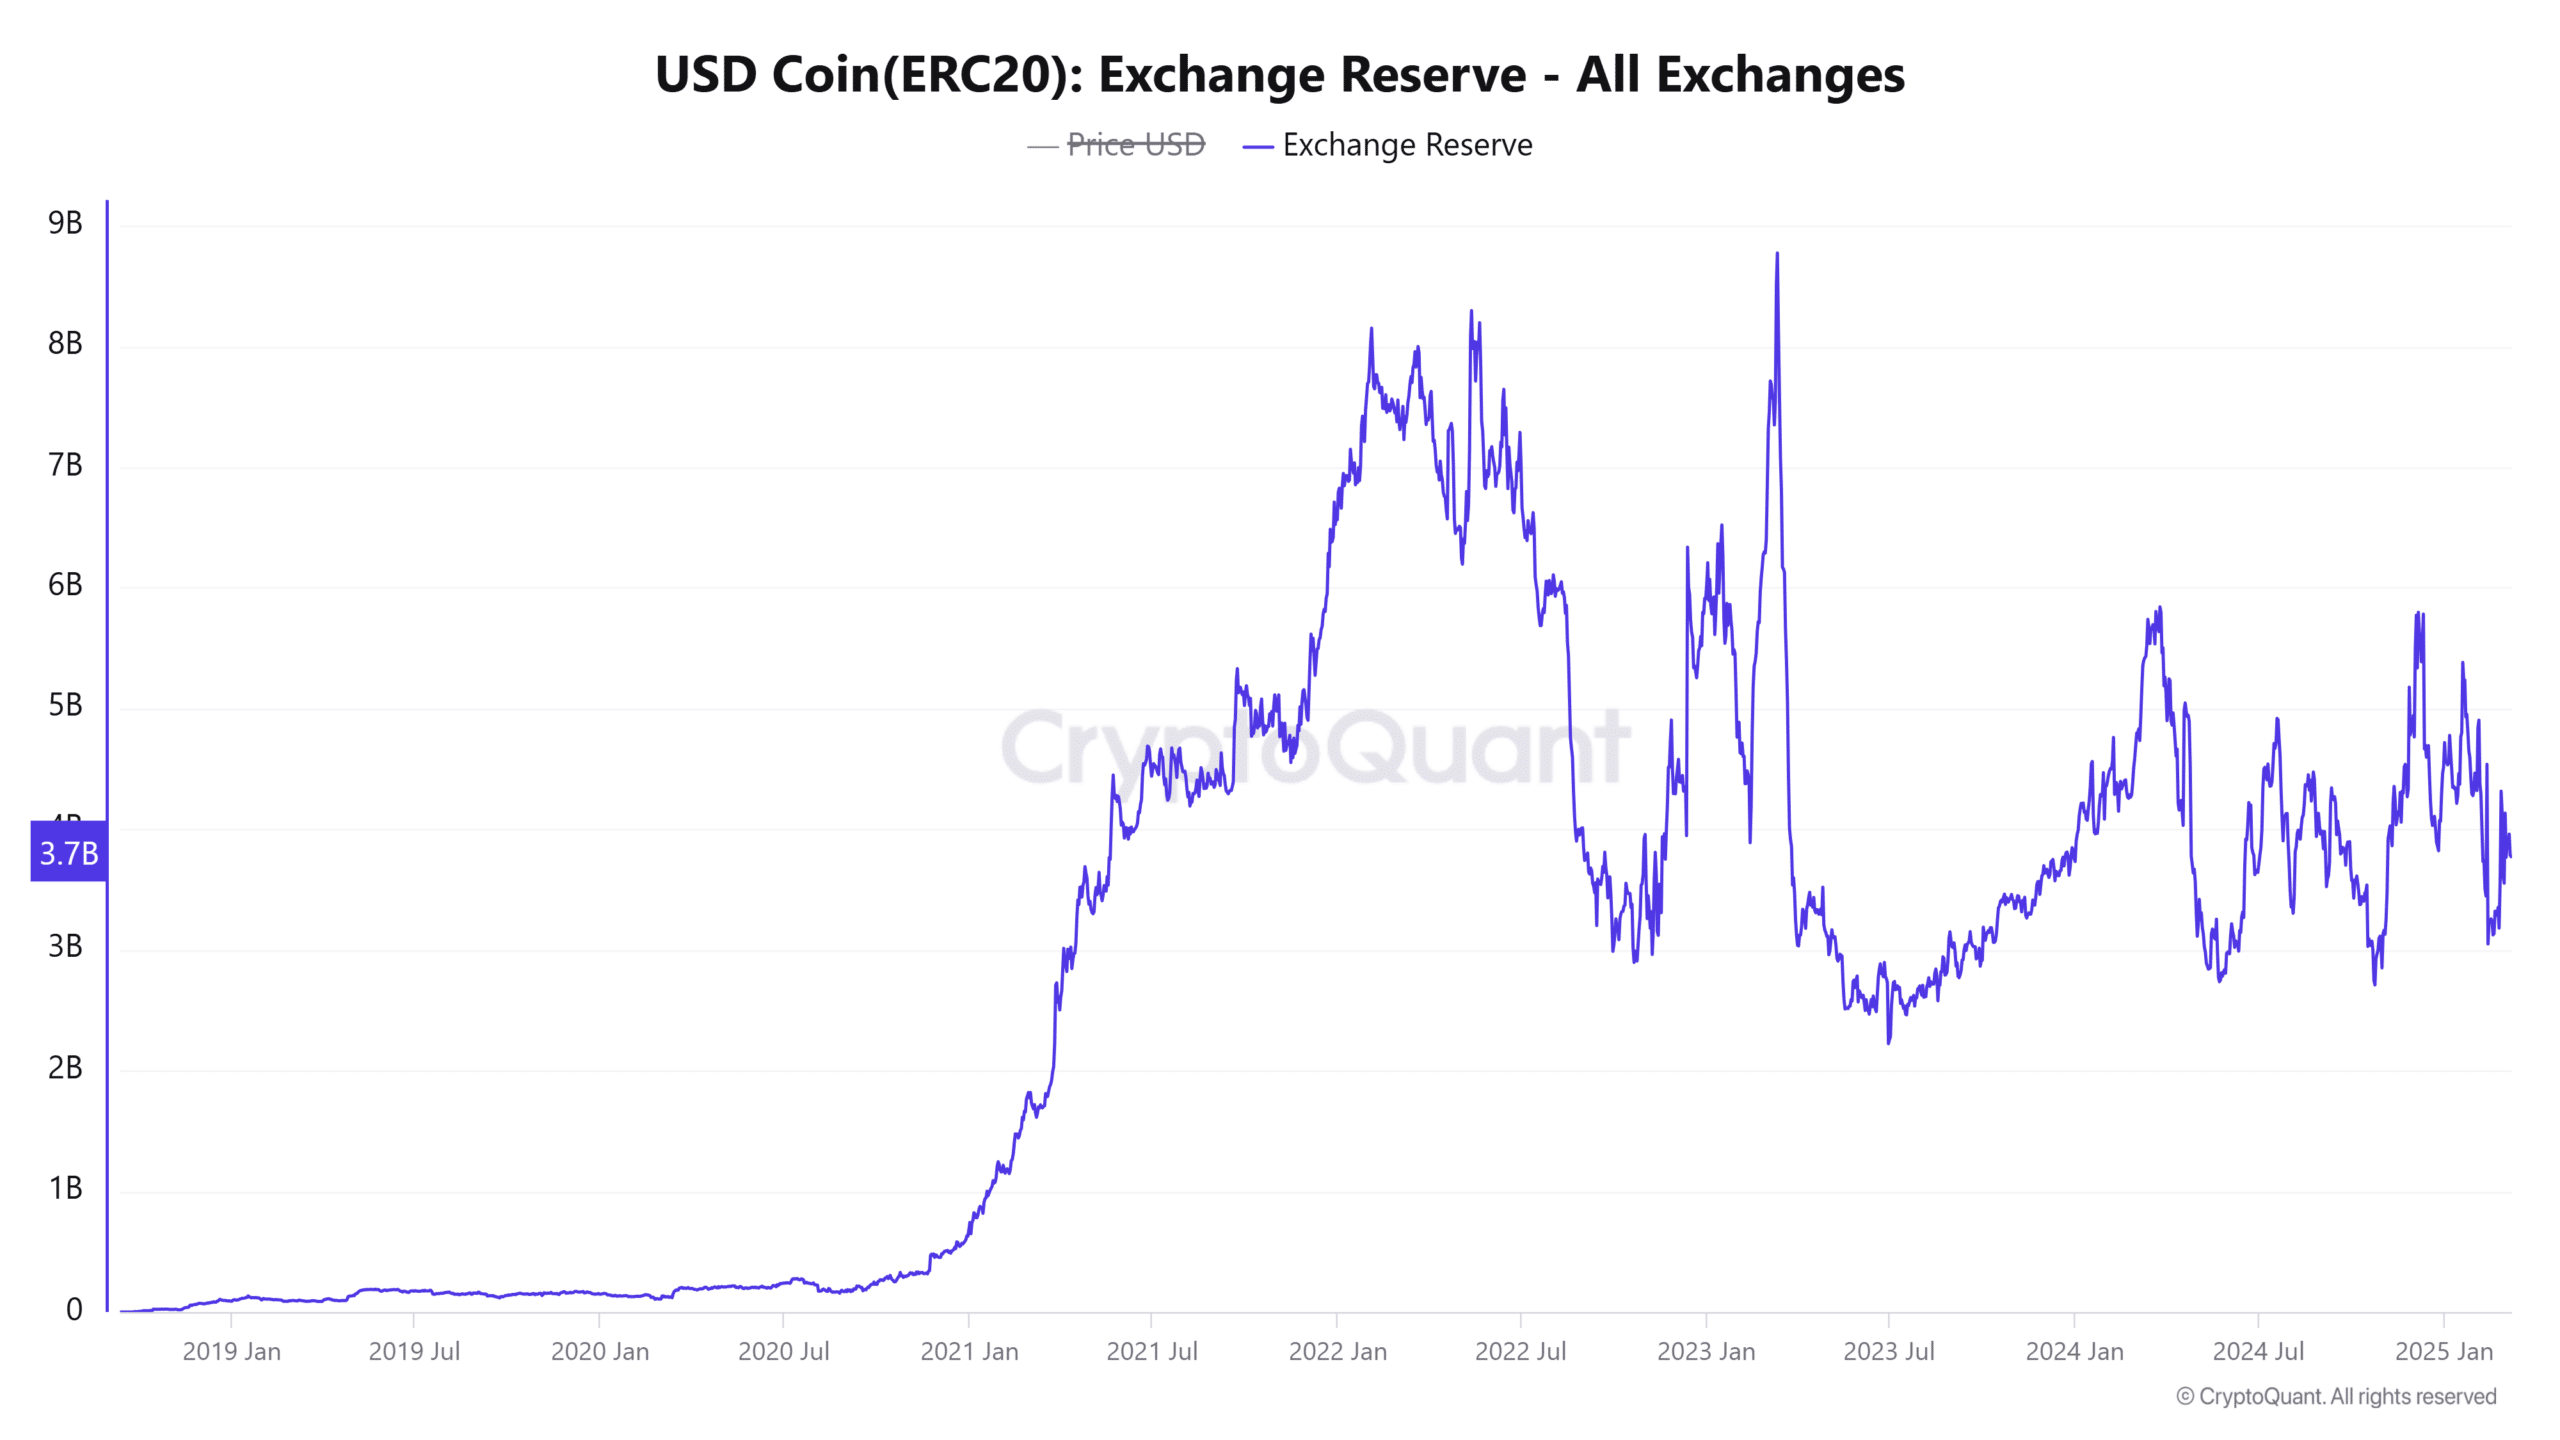
    USDC Exchange ReserveUSDC Exchange Reserve

    Source: CryptoQuant

    USD Coin also saw growth in its exchange reserves, but not as constant as USDT.

    The reserves were at $4.2 billion at press time, compared to USDT’s $42.1 billion. These volumes suggested that USDT likely remains the favored stablecoin for trading and liquidity purposes.

    Bitcoin Dominance ChartBitcoin Dominance Chart

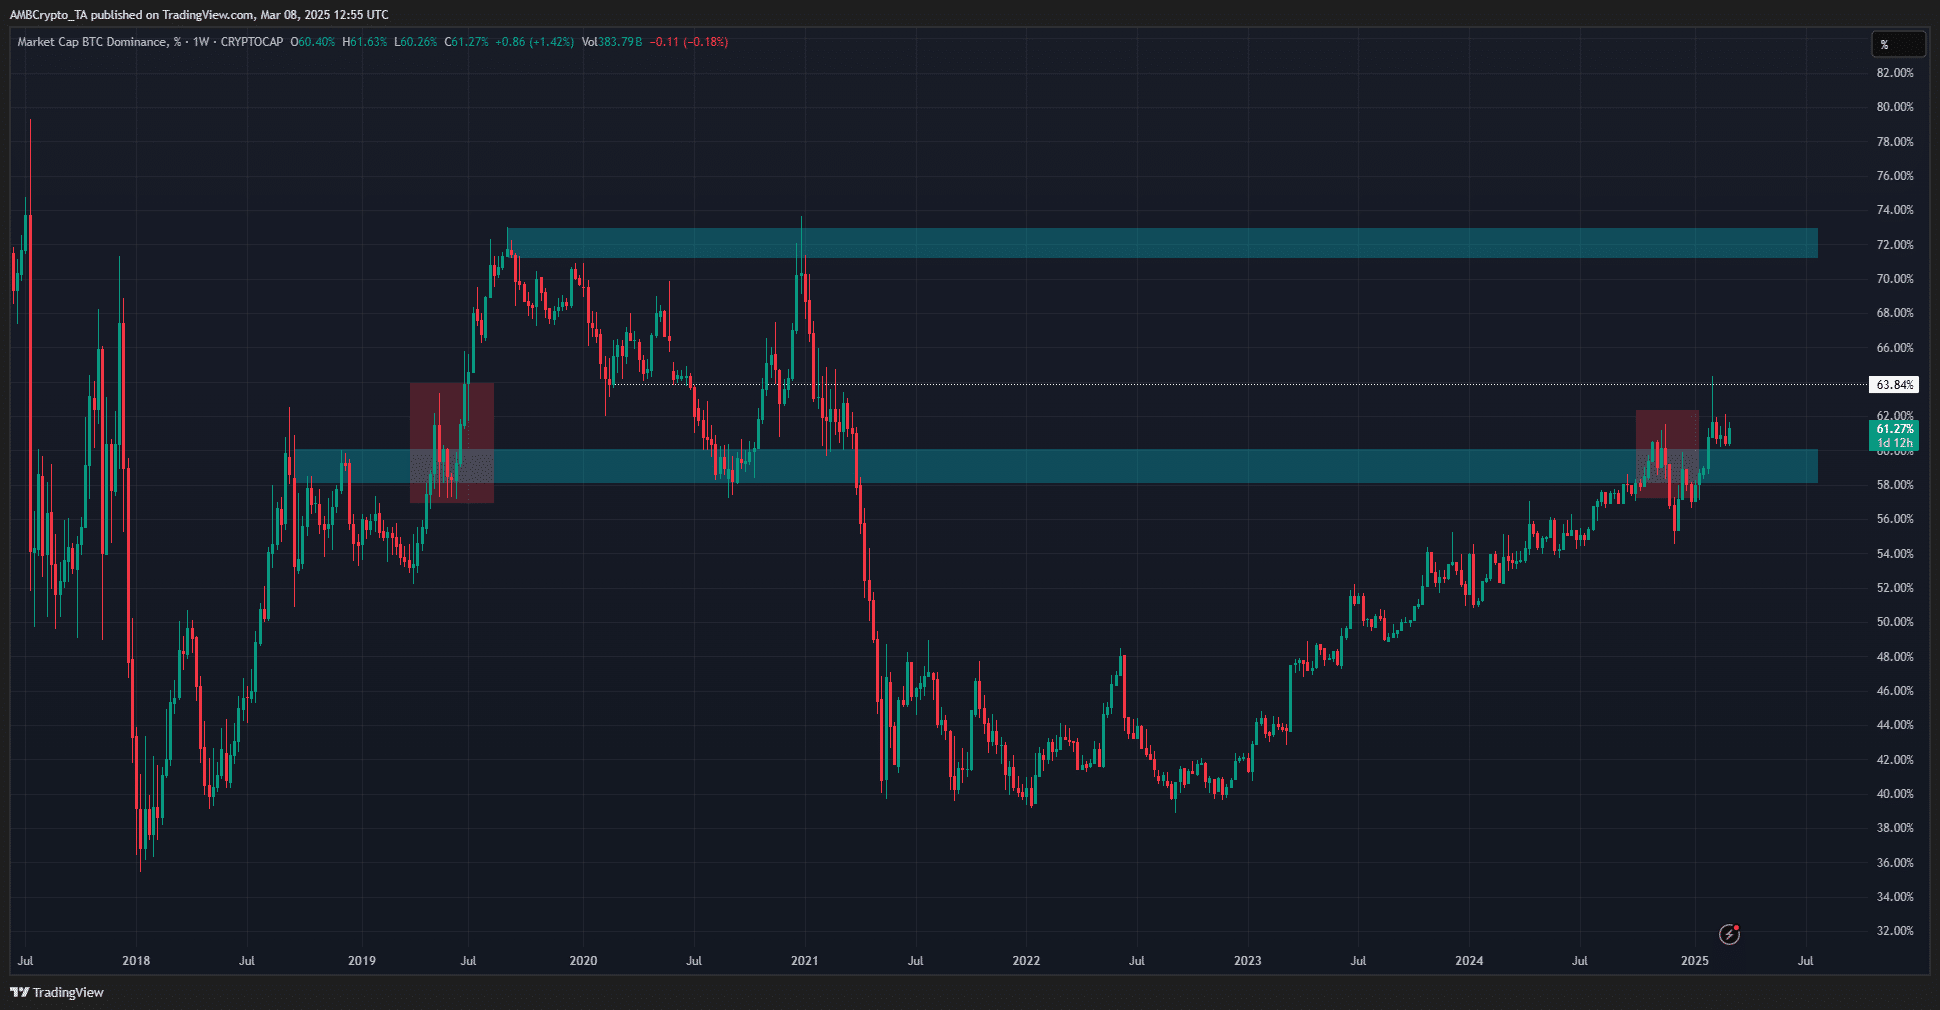
    Source: BTC.D on TradingView

    The weekly chart of BTC.D underlined some similarities between November-December 2024 and May 2019. On both occasions, the 60% level served as resistance and was flipped to support after a deviation beneath it.

    What remained was a move to the 72% level. Like stablecoin dominance, BTC.D is inversely correlated to altcoin performance. An uptick in BTC.D implies Bitcoin gaining more value than the altcoin market (or shed less value).

    However, capital rotation after strong BTC-centered gains could usher in an altseason. While the price action in recent months has killed this hope among market participants, perhaps, it might not be truly dead.

    Next: XRP’s $380M whale activity – Here’s what it means for the altcoin’s price!

    Follow on Google News Follow on Flipboard
    Share. Facebook Twitter Pinterest LinkedIn Tumblr Email Copy Link
    Previous ArticleBitcoin Whales Accumulate Over 30,000 BTC In 2 Weeks – Sign Of A Coming Impulse?
    Next Article El Salvador acquired over 13 BTC since March 1, despite IMF deal
    Avatar
    Yeek.io
    • Website

    Yeek.io is your trusted source for the latest cryptocurrency news, market updates, and blockchain insights. Stay informed with real-time updates, expert analysis, and comprehensive guides to navigate the dynamic world of crypto.

    Related Posts

    Why is crypto up today—FOMC news, ETF flows and…

    March 20, 2025

    Binance Coin (BNB) Price Prediction for March 20

    March 20, 2025

    Trump becomes first US sitting president to speak at a crypto conference

    March 20, 2025
    Leave A Reply Cancel Reply

    Advertisement
    Demo
    Latest Posts

    US Ethereum ETFs Record 4 Consecutive Weeks Of Positive Inflows — Details

    Here’s why Sonic erased $1.3 billion in value

    Whales lose SYRUP sweet tooth despite Maple Finance’s growth

    Ethereum Prepares For A Parabolic Move – ETH/BTC Chart Signals Strong Bullish Setup

    Popular Posts
    Advertisement
    Demo
    X (Twitter) TikTok Instagram

    Categories

    • Altcoin
    • Bitcoin
    • Blockchain
    • Crypto News

    Categories

    • Defi
    • Ethereum
    • Meme Coins
    • Nfts

    Quick Links

    • Home
    • About
    • Contact
    • Privacy Policy

    Important Links

    • Crypto Chart
    • Crypto Price Chart
    © 2025 Yeek. All Copyright Reserved

    Type above and press Enter to search. Press Esc to cancel.