 price down today?")
Ether (ETH) price declined by over 11.75% in the last 24 hours to around $1,900. At its intraday low, the cryptocurrency was trading for $1,755, its lowest price since October 2023.
ETH/USD four-hour price chart. Source: TradingView
Several factors appear to be contributing to ETH price losses, including:
-
US recession fears and its overall impact on risk-on markets.
-
Massive long liquidations in the crypto market.
-
Crypto loans backed by ETH as collateral facing liquidation risks.
-
Bearish technicals.
Ether price declines with risk-on assets
Ether’s ongoing price drop mirrors similar declines in the broader risk-on market due to unfavorable macroeconomic conditions.
Key points:
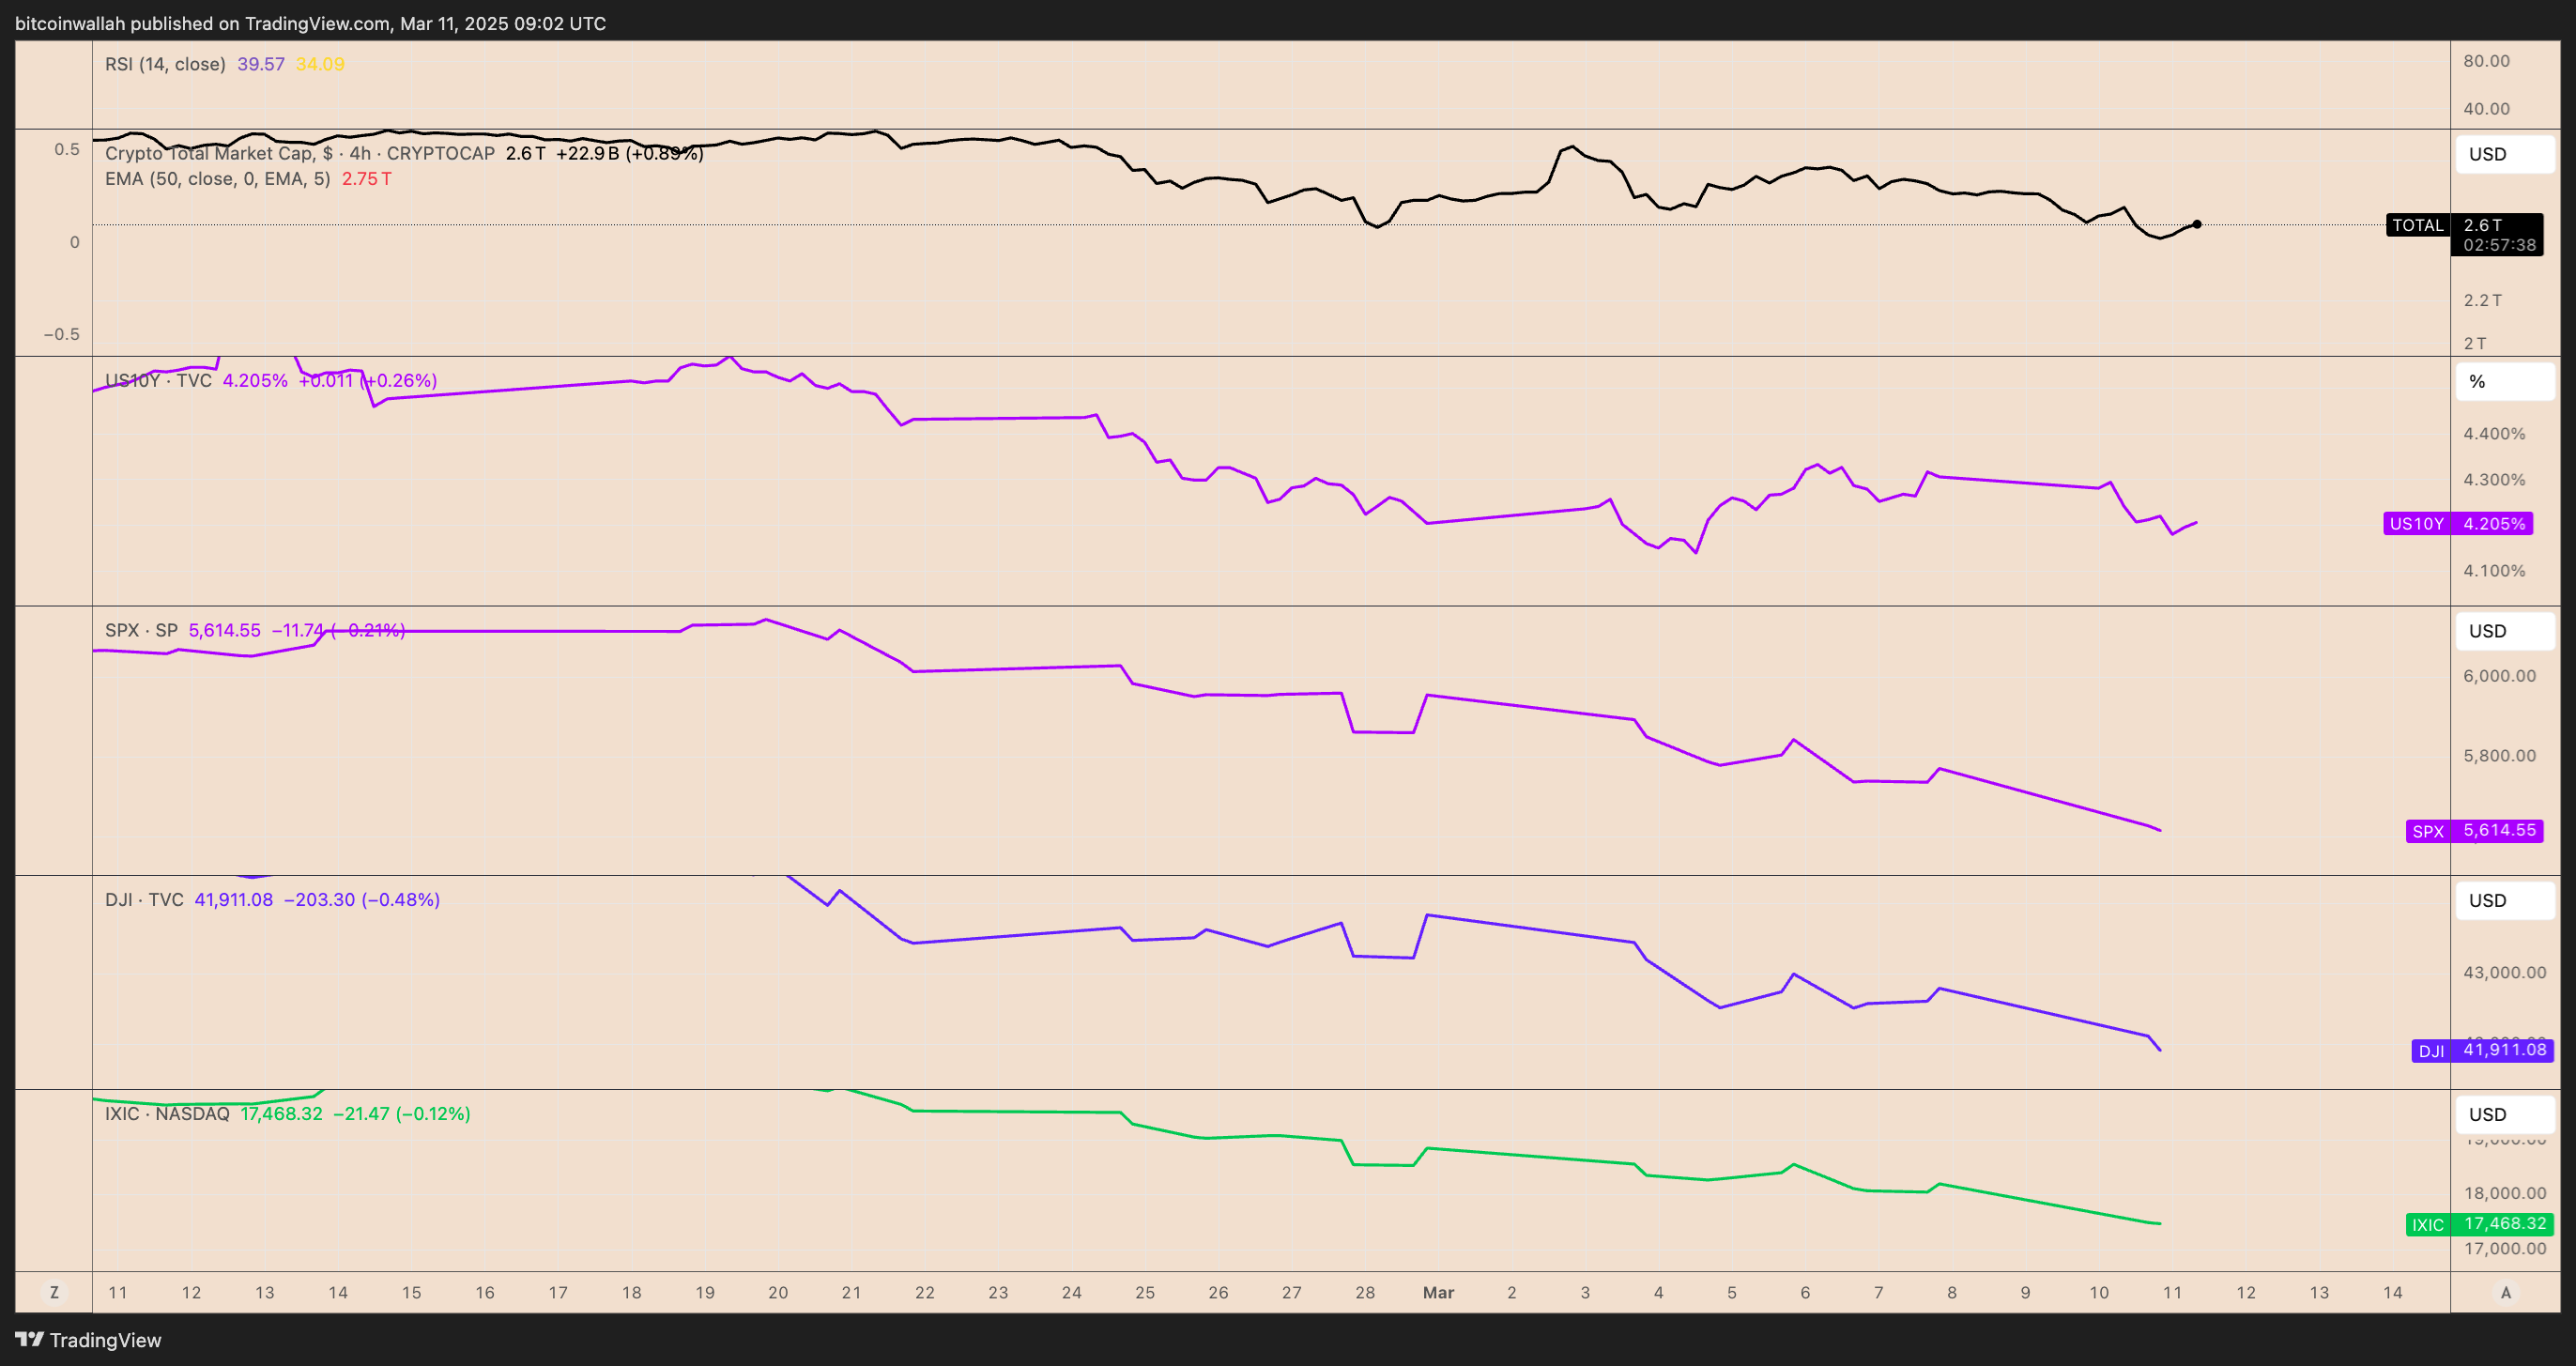
TOTAL crypto market cap vs. Nasdaq, Dow Jones, S&P 500, and US 10-year Treasury note yields four-hour chart. Source: TradingView
-
JPMorgan raised US recession risk to 40% for 2025, up from 30%, citing US President Donald Trump’s “extreme US policies” as a key risk factor.
-
Goldman Sachs also raised its 12-month recession probability to 20%, up from 15%.
-
Earlier in March, Trump imposed 25% tariffs on all goods from Mexico and Canada, and 10% tariffs on Chinese imports.
-
Canada and Mexico have announced intentions to impose retaliatory tariffs on US goods, escalating trade tensions and raising concerns about a potential trade war.
-
Meanwhile, China has already retaliated by increasing tariffs on multiple US products and imposing export controls and investment restrictions on 25 US firms.
-
These tariffs are expected to increase consumer prices and contribute to US inflation.
US recession fears are impacting Ethereum and the crypto sector, notably:
-
Ether, Bitcoin, and other top-ranking crypto assets have historically declined during periods of economic turbulences, e.g., the Covid-19 sell-off in March 2020.
-
As of March 11, the 52-week correlation between the crypto market and the US benchmark index, the S&P 500 index, was 0.69.
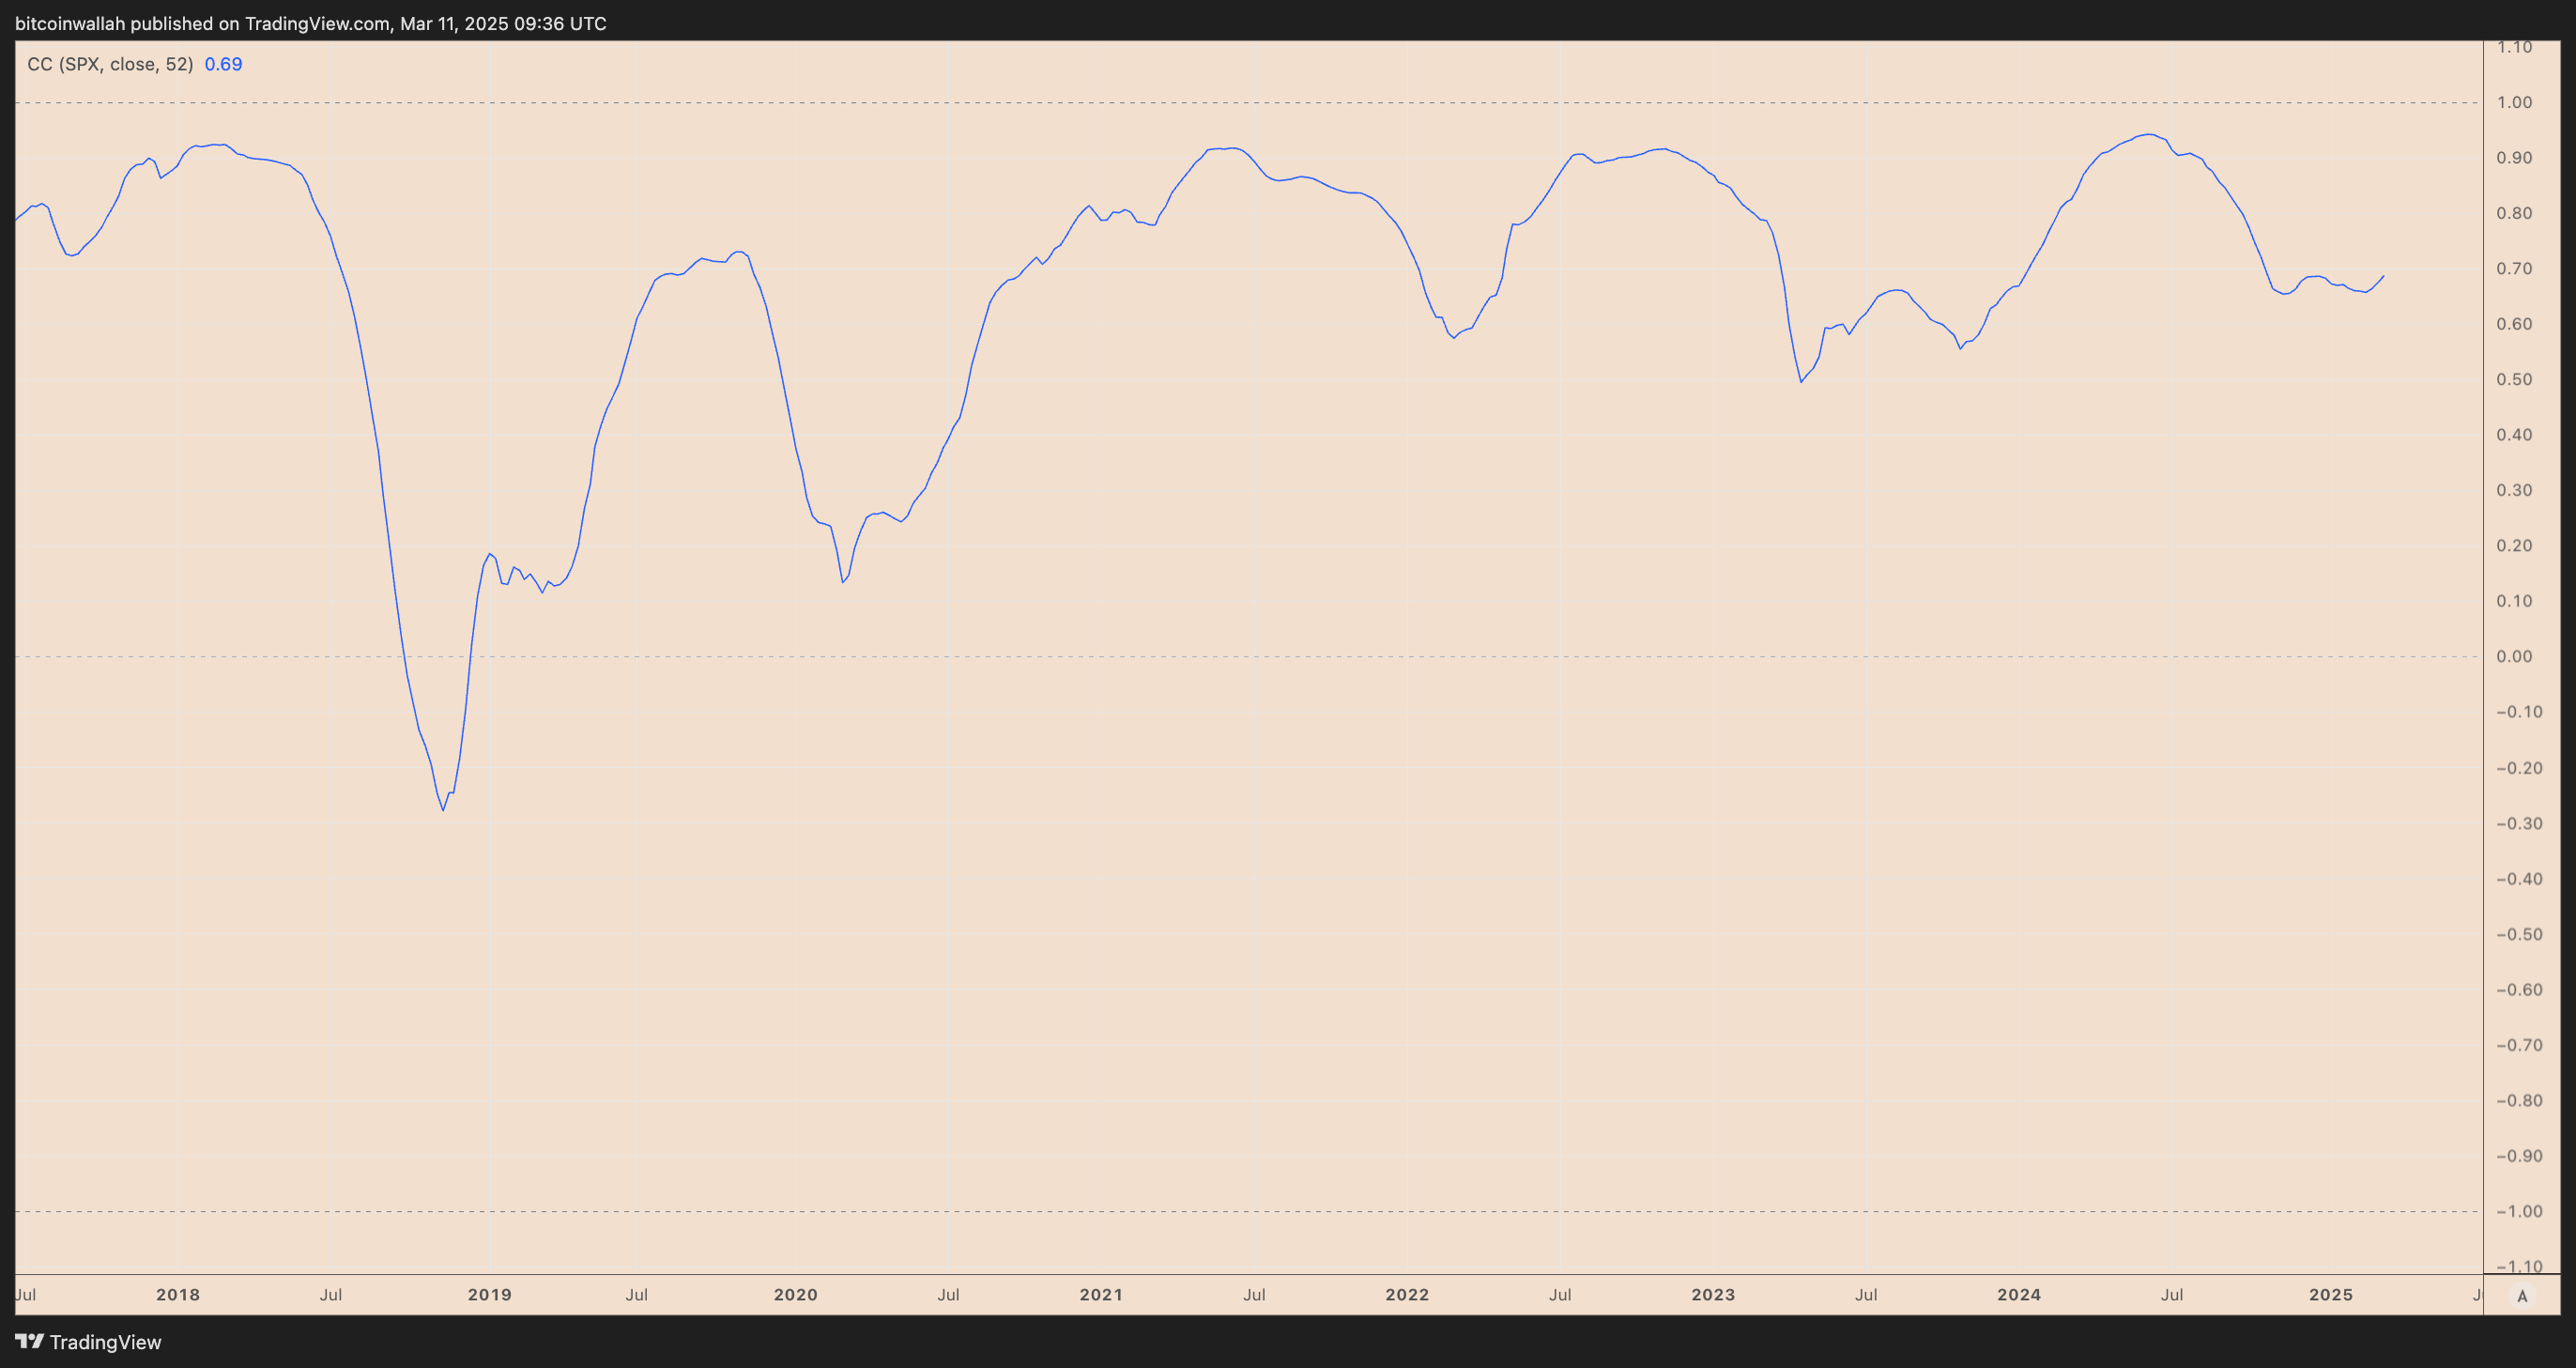
TOTAL crypto market cap and S&P 500’s 52-week correlation coefficient. Source: TradingView
-
A consistently positive correlation increases the odds of a crypto market decline if US stocks keep falling, especially as the trade war drags on further.
-
Bond traders see no need for a rate cut before June, with CME data showing 95% and 52.5% odds of a pause in the Fed’s March and May meetings, respectively.
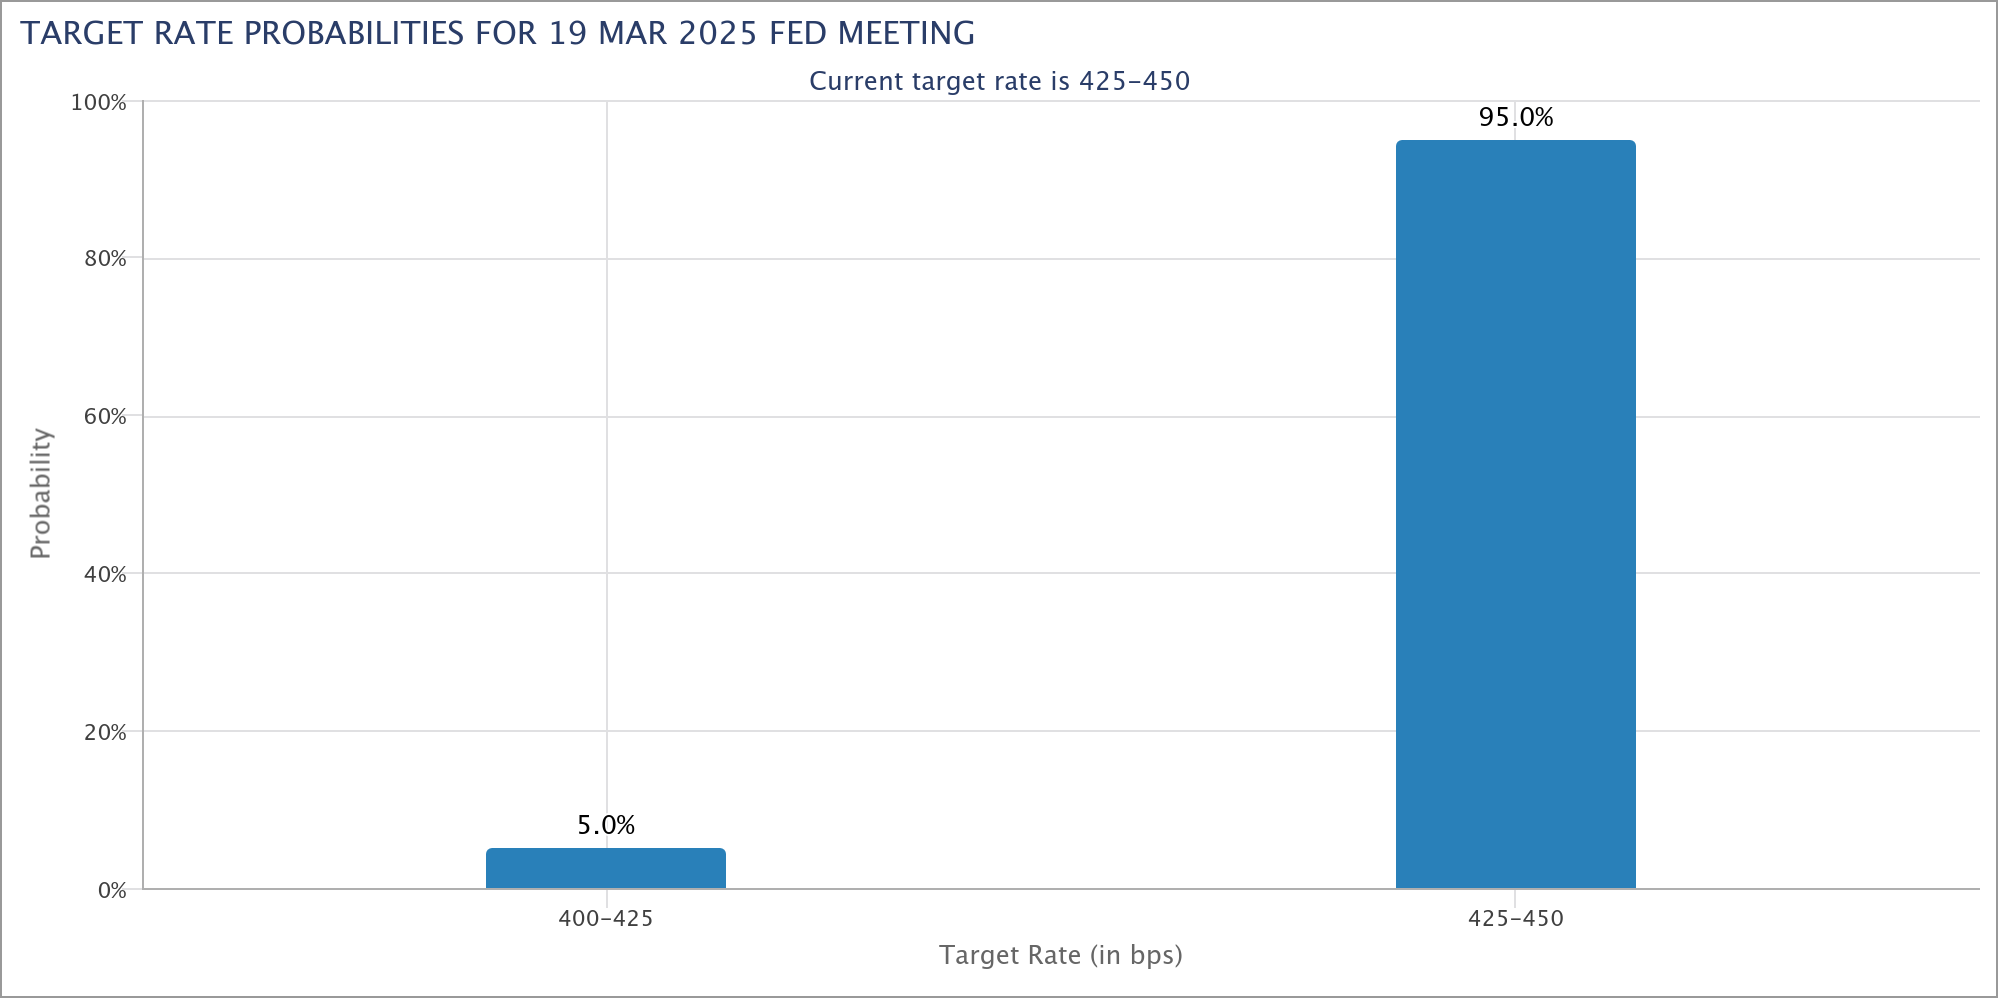
Target rate probabilities for March’s Fed meeting. Source: CME
Bad DeFi loans increase Ether sell-off pressure
A $74 million DeFi loan on the Sky protocol, collateralized with $130 million in ETH, almost got liquidated after Ether price fell below the liquidation level just above $1,900.
As it happened:
-
The borrower added $34 million in ETH as collateral to avoid liquidation.
-
Withdrew $1.6 million in USDT from Binance, swapped it for DAI, and deposited into Maker.
-
Reduced debt to $73.1 million while ETH’s price continued to decline.
-
Liquidation level remained at $1,836 per ETH, closer to ETH’s current price above $1,900.
-
Nearly $353 million in debt is tied to such loans, risking liquidation if ETH’s price falls 20% from here.
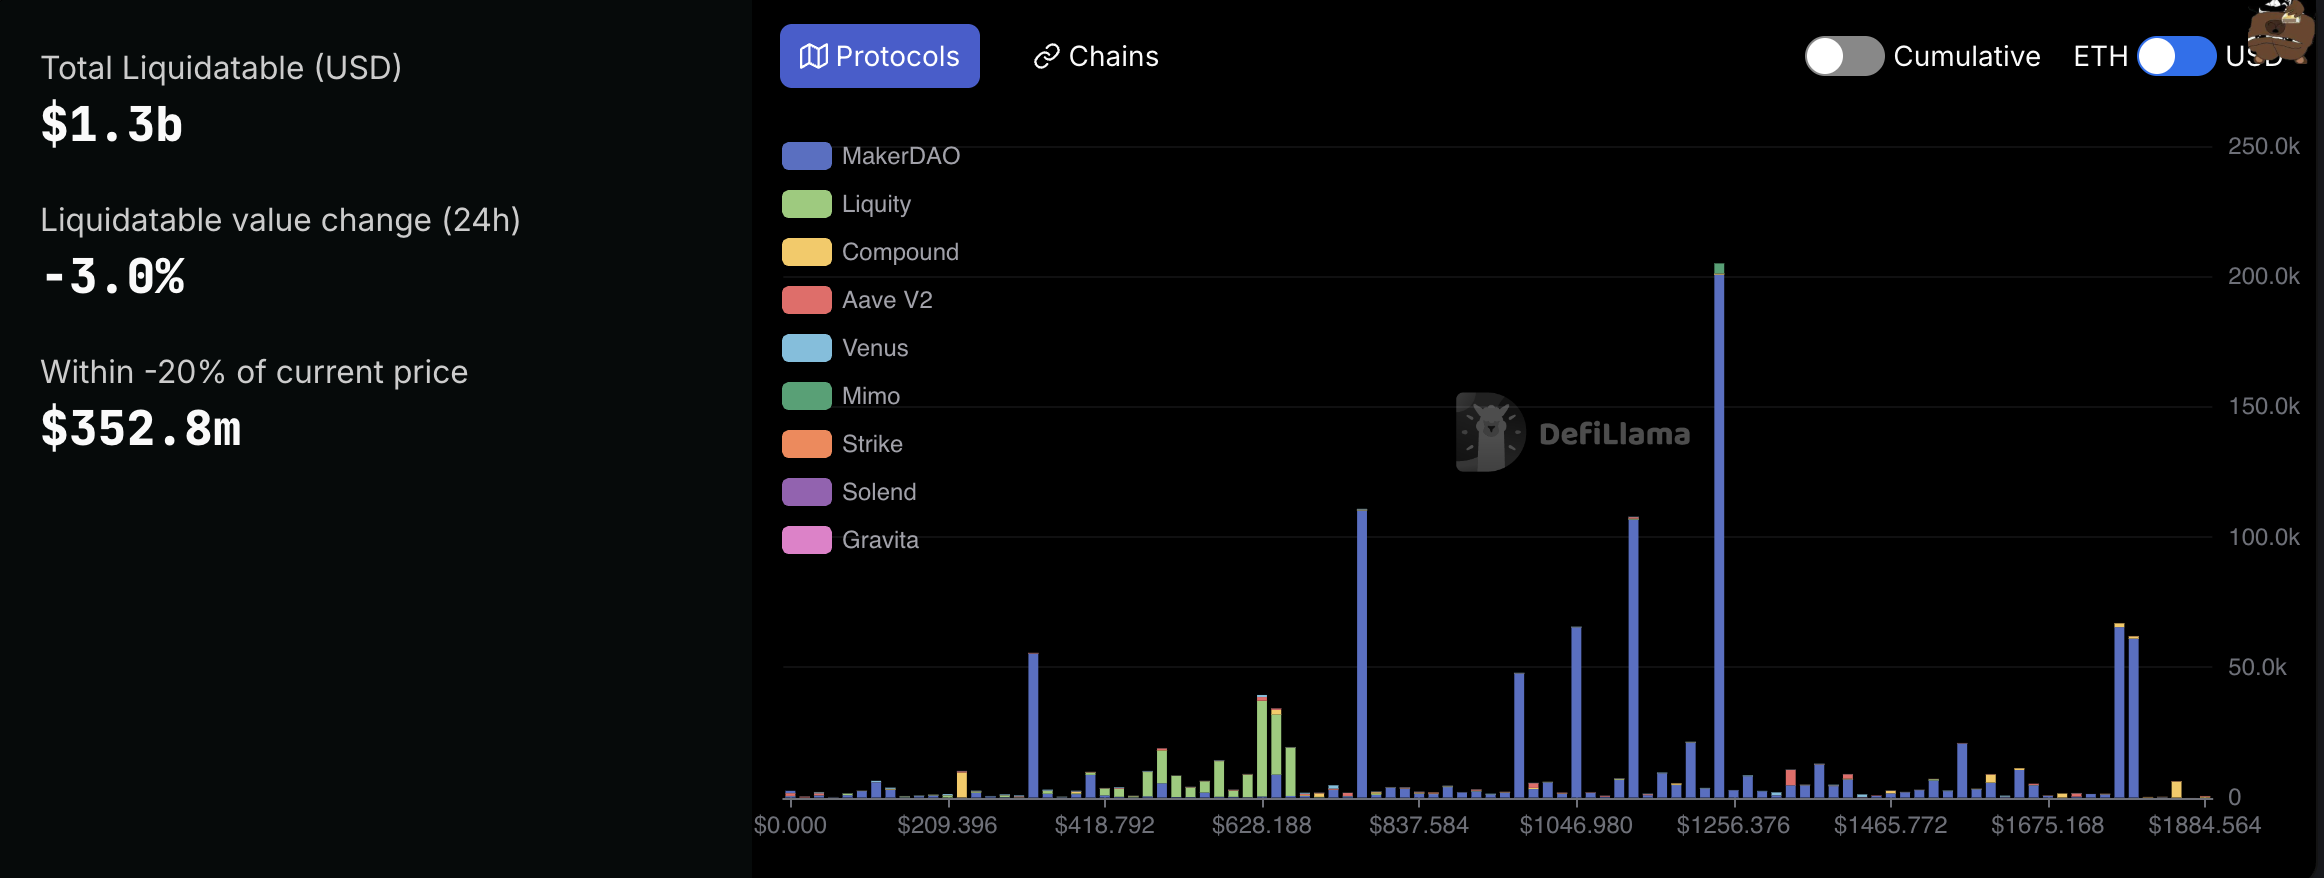
Ethereum liquidation levels in DeFi. Source: DefiLlama
Long liquidations accelerate ETH downtrend
Ether’s tumble over the past 24 hours coincided with a wave of long liquidations that forced traders to exit their leveraged positions.
Key takeaways:
-
Over $240 million worth of ETH positions were wiped out in the last 24 hours, with long liquidations accounting for $196.27 million, or 82% of the total.
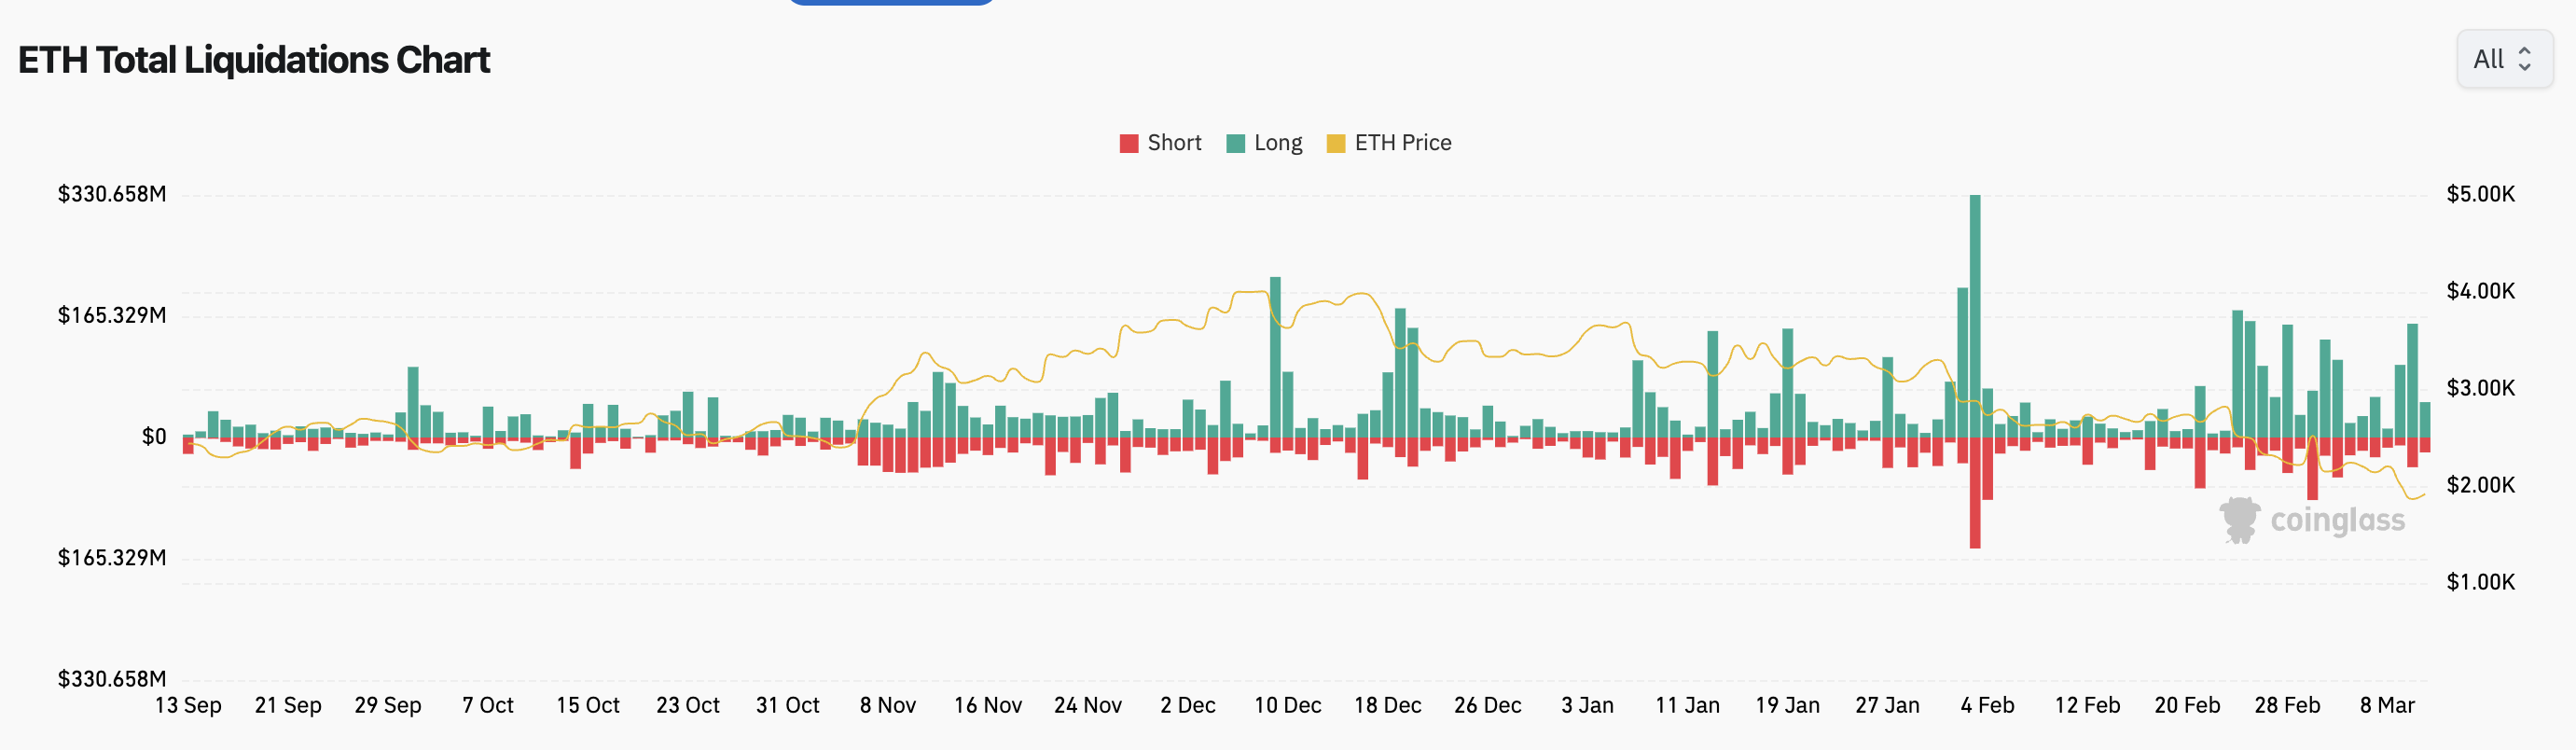
ETH total liquidation chart. Source: Coinglass
-
The sharp price drop triggered a cascade of forced sell-offs as traders betting on Ethereum’s price increase were liquidated.
-
When leveraged long positions fail to maintain margin requirements, exchanges automatically sell off their holdings to cover losses.
-
Such liquidations accelerate price declines, exacerbating the downturn.
-
The broader crypto market also experienced a sharp deleveraging event, with total liquidations reaching $897.26 million across assets.
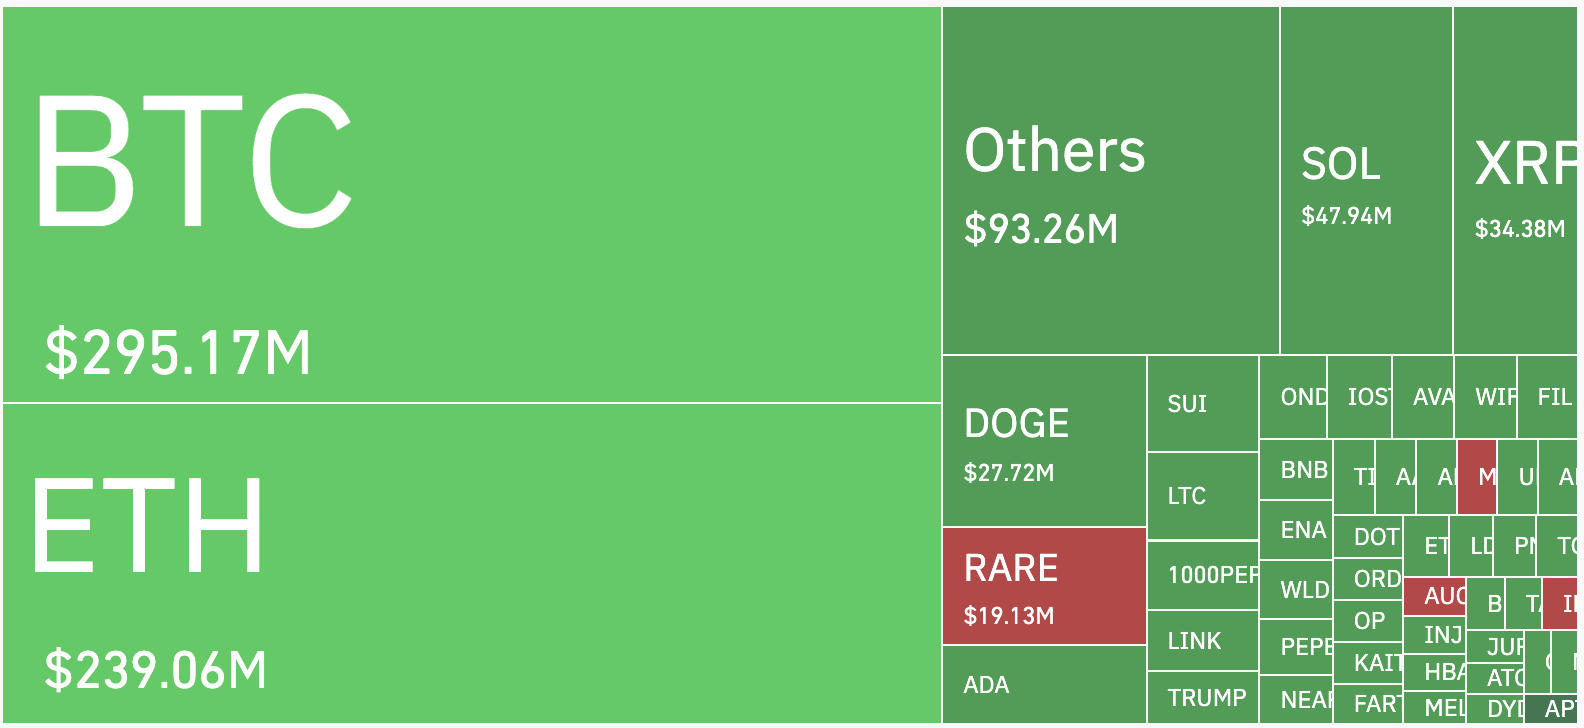
Crypto market liquidations (24 hours). Source: TradingView
Ether eyes further decline toward $1,700
From a technical perspective, Ether’s price decline today is part of its prevailing inverse-cup-and-handle (IC&H) pattern.
Key points:
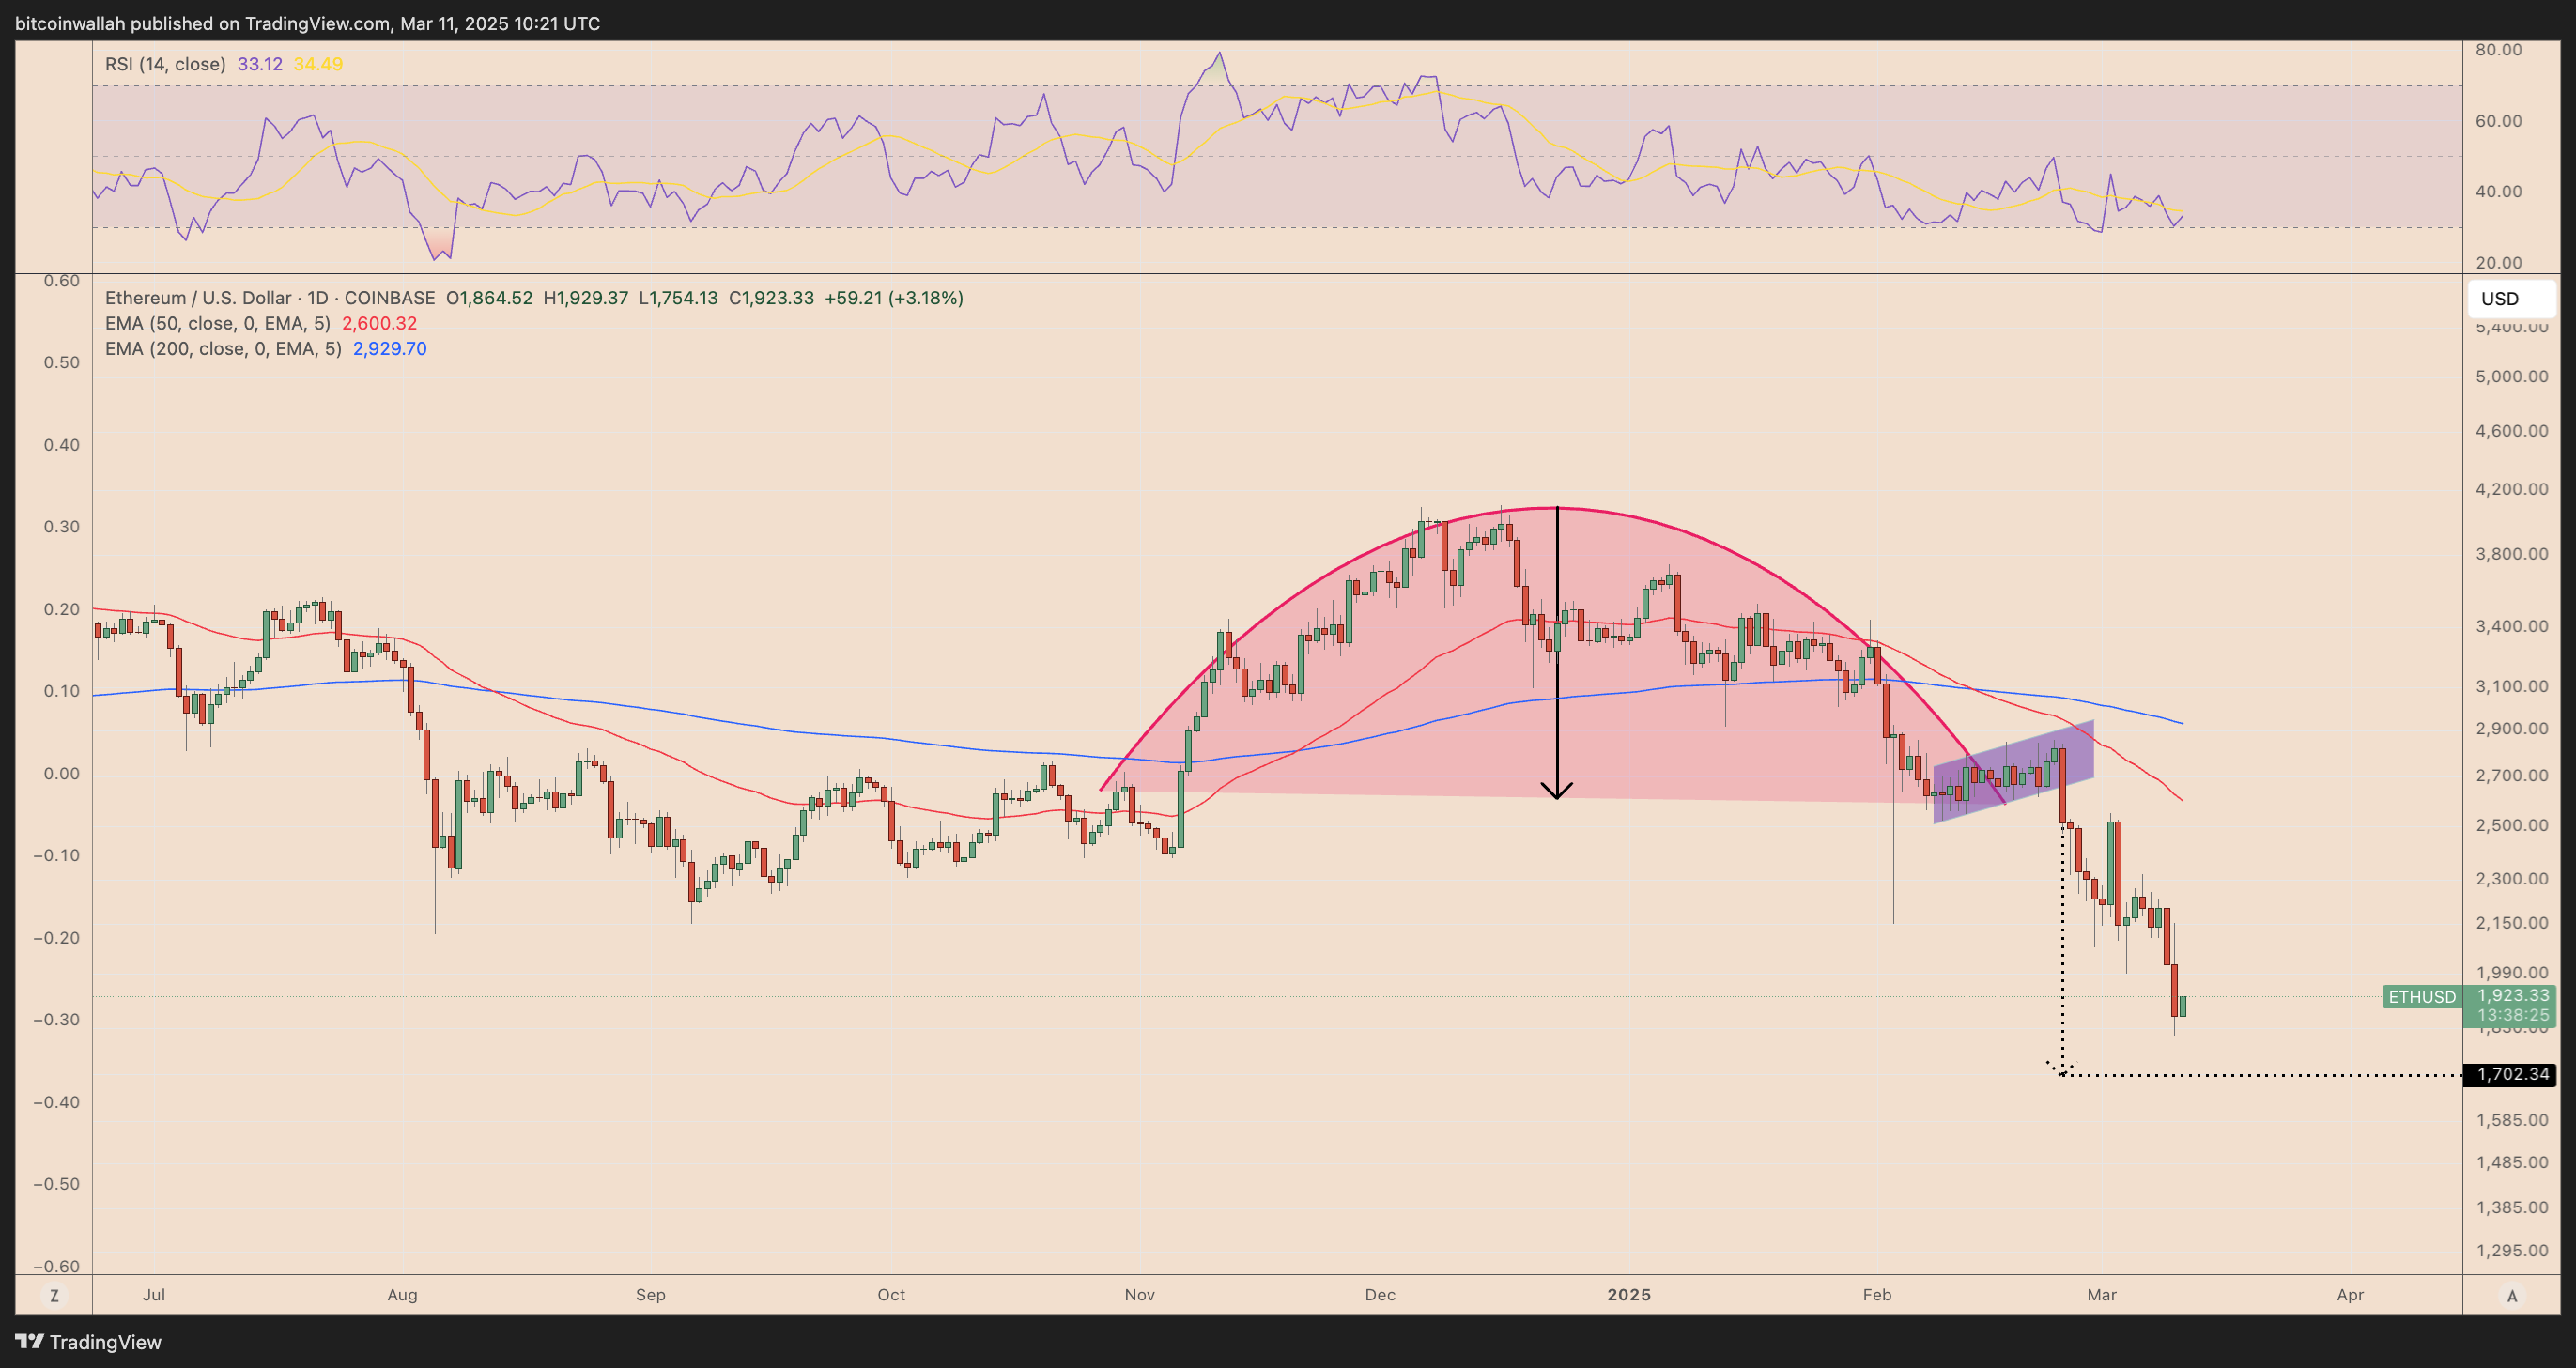
ETH/USD daily price chart. Source: TradingView
-
A temporary consolidation (handle) formed near $2,700, indicating a failed breakout attempt.
-
ETH broke below key support levels, confirming the IC&H breakdown, leading to more losses.
-
The measured move target from the pattern suggests a potential decline toward $1,700, aligning with the dotted support level.
-
The 50-day EMA ($2,600) and 200-day EMA ($2,929) remain far above, reinforcing bearish sentiment.
Key levels to watch:
-
ETH price is inside a descending channel pattern since late February.
-
As of March 11, the ETH/USD pair was rising after testing the channel’s lower trendline as support.
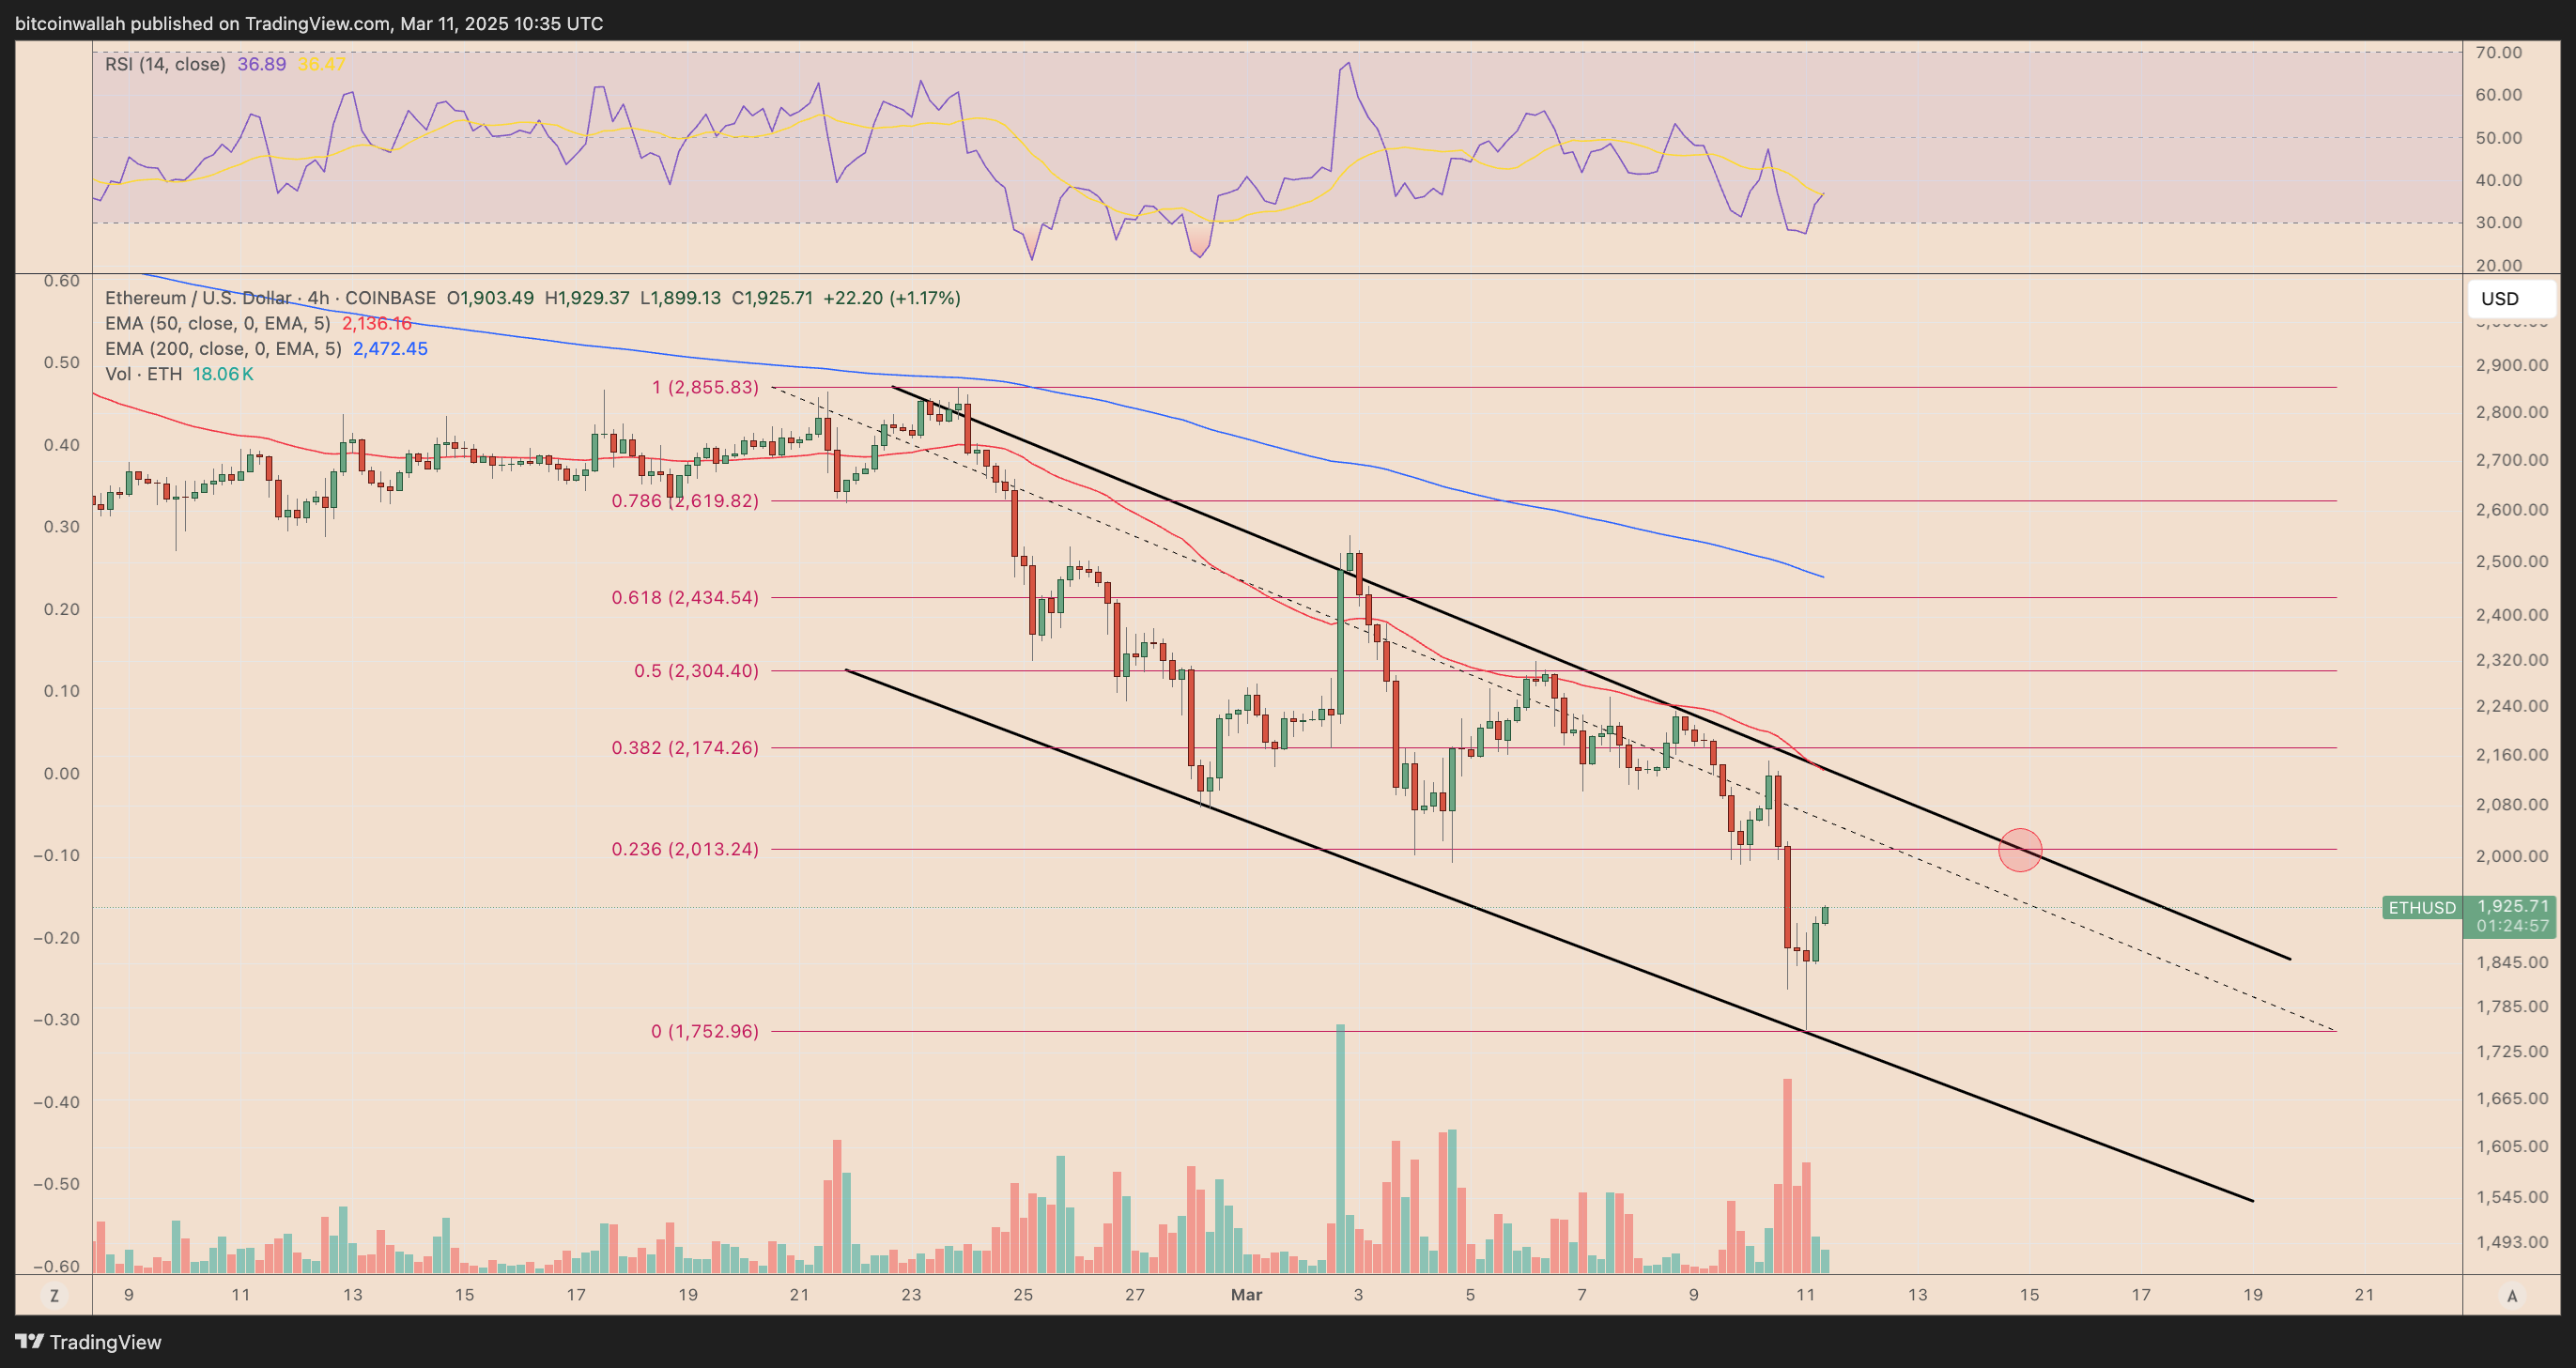
ETH/USD four-hour price chart. Source: TradingView
-
Such rebounds have taken prices toward the channel’s upper trendline in recent history.
-
If the fractal repeats, ETH’s next upside target could be around $2,000, aligning with the 0.236 Fibonacci retracement line.
-
A reversal from current price levels could have ETH test the IC&H downside target of $1,700.
This article does not contain investment advice or recommendations. Every investment and trading move involves risk, and readers should conduct their own research when making a decision.