Close Menu
    What's Hot

    Ethereum Prepares For A Parabolic Move – ETH/BTC Chart Signals Strong Bullish Setup

    Ethereum Enters Strategic Pause: Will Accumulation Below Resistance Spark A Surge?

    Solana indicators point north, bulls test $165 target

    Facebook X (Twitter) Instagram
    yeek.io
    • Crypto Chart
    • Crypto Price Chart
    X (Twitter) Instagram TikTok
    Trending Topics:
    • Altcoin
    • Bitcoin
    • Blockchain
    • Crypto News
    • DeFi
    • Ethereum
    • Meme Coins
    • NFTs
    • Web 3
    yeek.io
    • Altcoin
    • Bitcoin
    • Blockchain
    • Crypto News
    • DeFi
    • Ethereum
    • Meme Coins
    • NFTs
    • Web 3
    Altcoin

    MOVE price hikes 7% in 24 hours, 33% up from weekly lows – What next?

    Yeek.ioBy Yeek.ioMarch 11, 2025No Comments2 Mins Read
    Share Facebook Twitter Pinterest Copy Link Telegram LinkedIn Tumblr Email
    Share
    Facebook Twitter LinkedIn Pinterest Email
    • MOVE has a bearish structure on the 4-hour chart despite the recent bounce from the lows.
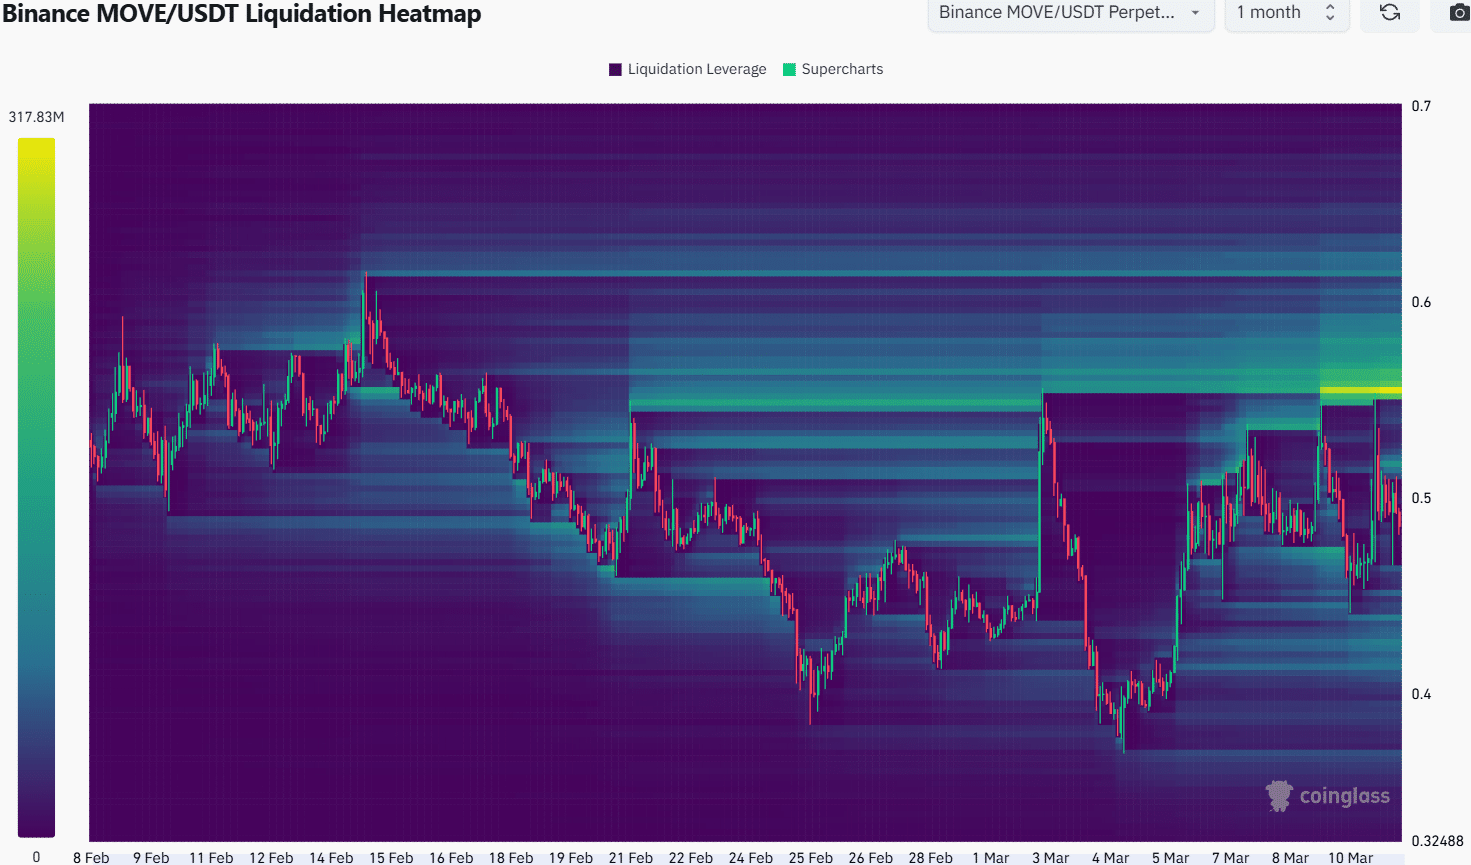
    • The liquidation heatmap underlined the $0.55 level as a key resistance zone.

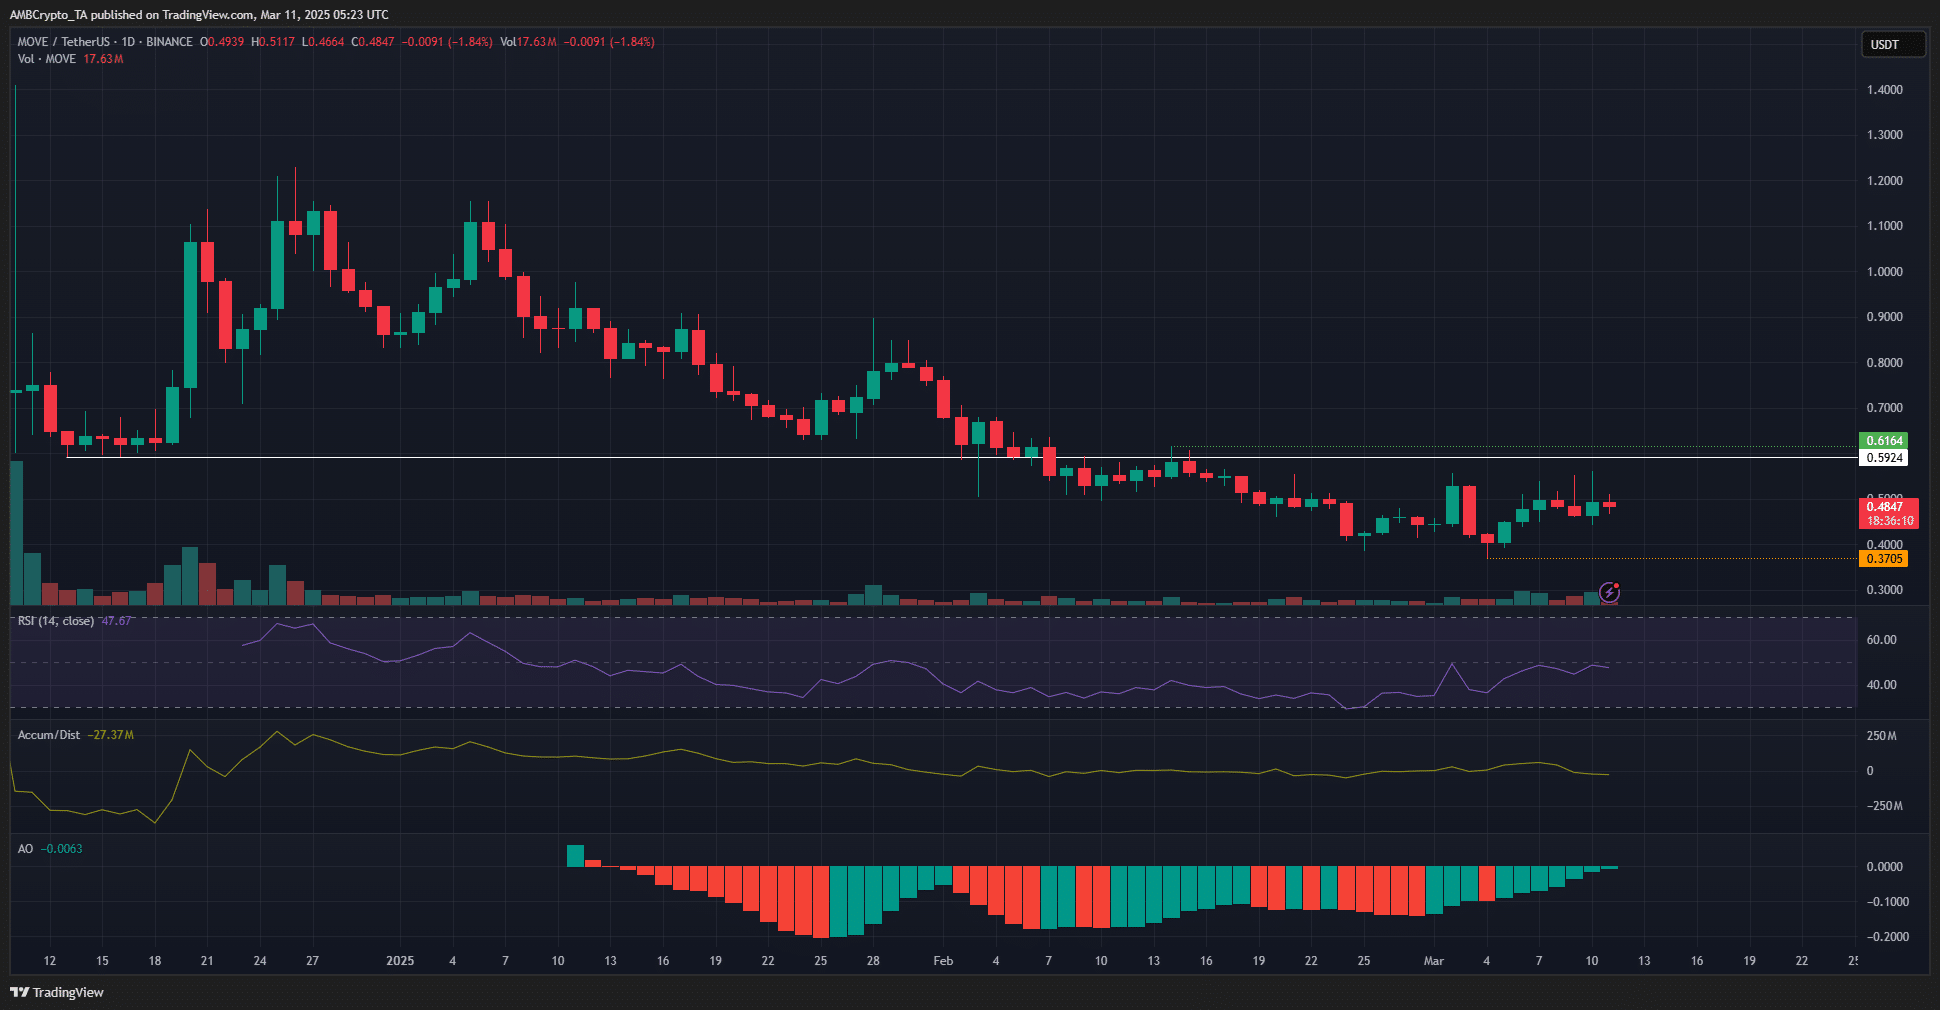
    Movement [MOVE] has bounced 33% from the past week’s low at $0.37, but it maintained its bearish near-term outlook. The buying pressure was not enough to breach the key resistance at $0.55. Further north, the $0.616 level marked the level whose breach would mark a structural shift for MOVE.

    The trend of Bitcoin [BTC] was strongly bearish. It might not have formed a bottom yet, which meant Movement price could also dive lower in case of another wave of selling for BTC.

    Hence, traders can maintain a bearish outlook for the coming week.

    Conditions MOVE’s price must be met to shift the outlook

    Movement 4-hour Chart

    Source: MOVE/USDT on TradingView

    MOVE’s market structure remains bearish, with a recent lower high on the 4-hour chart at $0.616. A session close above this level could signal a bullish shift.

    On the downside, the lower low at $0.37 is critical—falling below this level would confirm the continuation of the downtrend.

    On shorter timeframes, the $0.53 level is notable. Previously a support, it now acts as resistance, with the $0.53–$0.55 zone likely to challenge bulls in the near term.

    The Awesome Oscillator suggests a potential momentum swing, while the RSI sits at 47 and is approaching 50, signaling a possible buyer advantage. However, the A/D indicator shows no clear trend, with gains from early March fading back to February levels.

    MOVE Liquidation HeatmapMOVE Liquidation Heatmap

    Source: Coinglass

    The past month’s liquidation heatmap identified $0.55 as the strongest magnetic zone, with a smaller liquidity cluster at $0.52. The price is likely to move upward and sweep the $0.55 level soon.

    However, whether the short-term bullish momentum can be sustained beyond this point remains uncertain. A bearish reversal seems more probable due to weak buying pressure and the overall market structure.

    Disclaimer: The information presented does not constitute financial, investment, trading, or other types of advice and is solely the writer’s opinion

    Next: Mt. Gox fires off second $900M+ Bitcoin transfer in a week as BTC tumbles to $76K

    Follow on Google News Follow on Flipboard
    Share. Facebook Twitter Pinterest LinkedIn Tumblr Email Copy Link
    Previous ArticleIs altseason dead? Bitcoin ETFs rewrite crypto investment playbook
    Next Article Why Dogecoin whales are scooping up DOGE even as price falls
    Avatar
    Yeek.io
    • Website

    Yeek.io is your trusted source for the latest cryptocurrency news, market updates, and blockchain insights. Stay informed with real-time updates, expert analysis, and comprehensive guides to navigate the dynamic world of crypto.

    Related Posts

    Why is crypto up today—FOMC news, ETF flows and…

    March 20, 2025

    Binance Coin (BNB) Price Prediction for March 20

    March 20, 2025

    Trump becomes first US sitting president to speak at a crypto conference

    March 20, 2025
    Leave A Reply Cancel Reply

    Advertisement
    Demo
    Latest Posts

    Ethereum Prepares For A Parabolic Move – ETH/BTC Chart Signals Strong Bullish Setup

    Ethereum Enters Strategic Pause: Will Accumulation Below Resistance Spark A Surge?

    Solana indicators point north, bulls test $165 target

    Cardano is at the Nexus of Bitcoin DeFi: Charles Hoskinson

    Popular Posts
    Advertisement
    Demo
    X (Twitter) TikTok Instagram

    Categories

    • Altcoin
    • Bitcoin
    • Blockchain
    • Crypto News

    Categories

    • Defi
    • Ethereum
    • Meme Coins
    • Nfts

    Quick Links

    • Home
    • About
    • Contact
    • Privacy Policy

    Important Links

    • Crypto Chart
    • Crypto Price Chart
    © 2025 Yeek. All Copyright Reserved

    Type above and press Enter to search. Press Esc to cancel.