
Reason to trust
Strict editorial policy that focuses on accuracy, relevance, and impartiality
Created by industry experts and meticulously reviewed
The highest standards in reporting and publishing
Strict editorial policy that focuses on accuracy, relevance, and impartiality
Morbi pretium leo et nisl aliquam mollis. Quisque arcu lorem, ultricies quis pellentesque nec, ullamcorper eu odio.
Ethereum (ETH) has revisited yearly lows after losing the key $2,000 support, registering its worst performance in years. Some analysts forecasted another 15% drop if the trend continues but suggested that ETH could see a bullish end-of-year.
Related Reading
Ethereum Hits 17-Month Low
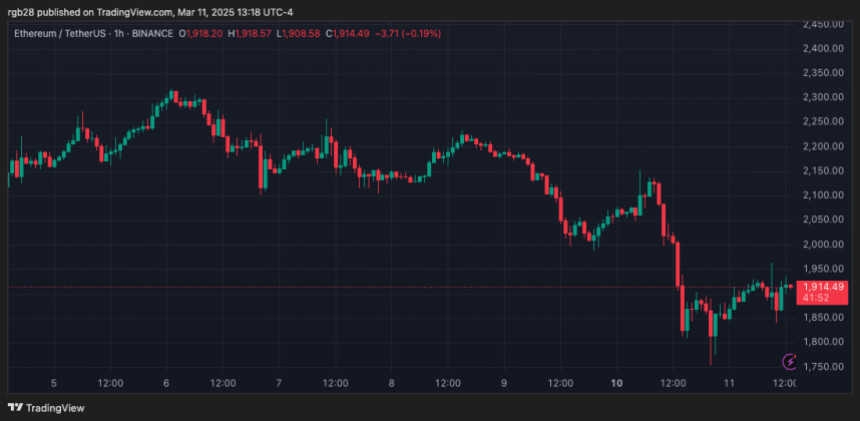
Ethereum experienced a 15% correction on Monday, falling from $2,150 to $1,810. ETH’s performance followed Bitcoin (BTC) and the rest of the market’s pullback, which saw the flagship crypto drop to $76,000 for the first time since the post-election breakout started.
As the retrace continued, the second-largest cryptocurrency by market capitalization dropped to its lowest level since November 2023, touching the $1,750 mark before recovering the $1,900 support.
Some market watchers pointed out that Ethereum has been in a three-month downtrend, retracing around 53% since its December peak. Trader Crypto Rand noted that the King of Altcoins has 20 days “to turn green,” or “it will be the first time since 2018 that ETH has experienced 4 x months of red in a row.”
That year, ETH spent seven consecutive months recording double-digit losses, losing approximately 80% of its value from May until November. CoinGlass data shows that March tends to be a favorable month for the cryptocurrency, with an average 20% return since 2016.
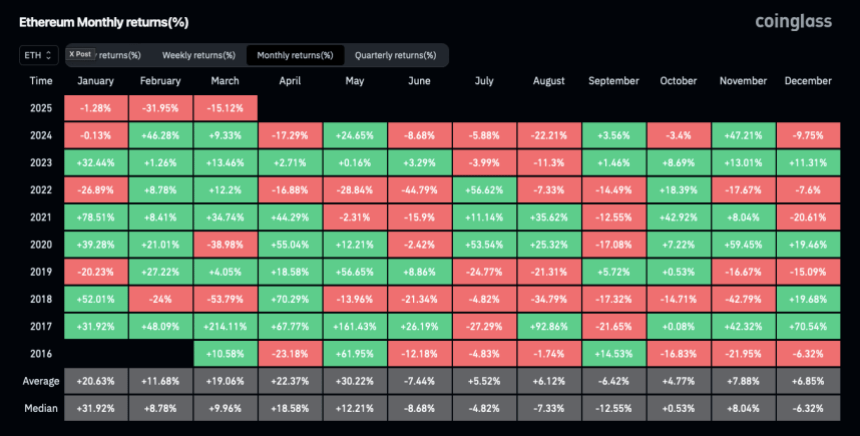
In 2024, the cryptocurrency closed the month with 9.33% gains, following a strong 46% performance in February. However, market sentiment has declined after back-to-back negative performances this year, with a 1.98% and 31.95% decline in January and February, respectively.
The cryptocurrency registers a 15.12% loss Month-to-Date (MTD) and could see its worst Q1 close since 2018 at current levels. As a result, Ethereum must close this month above the $2,237 mark to prevent its second-worst historical performance.
ETH Drop To $1,600 Coming?
Some market watchers highlighted that the cryptocurrency’s current performance reached FTX-crash levels, with sentiment leaning towards a deeper correction. Crypto analyst Ted Pillows noted that Ethereum could see another 15% correction now that the $2,000 support has been lost.
According to the post, “there’s a good chance ETH will retest the $1.6K-$1.8K level” as the “manipulation phase is ongoing.” The analyst suggested a potential Power of Three (Po3) pattern on ETH’s chart, which divides the price cycle into three distinctive phases: accumulation, manipulation, and distribution.
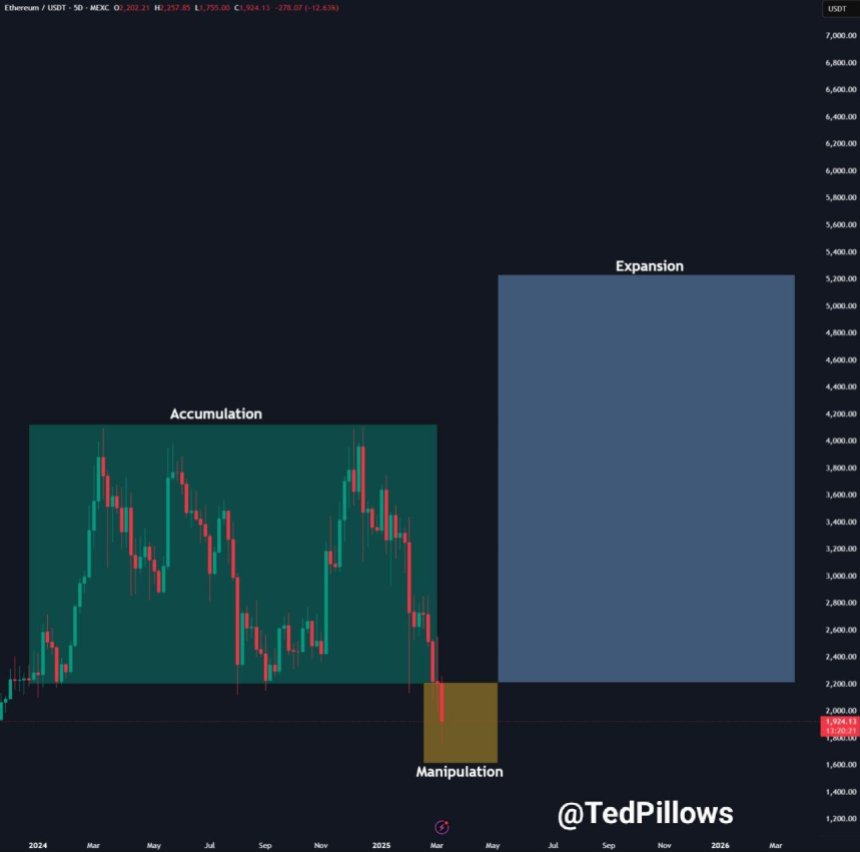
The accumulation phase consists of a consolidation near the recent high after a strong price performance. In the manipulation phase, a token’s price falls below the accumulation phase’s support level and trades within a range below the lost zone. Meanwhile, the distribution phase sees a strong price breakout to build momentum and drive participants to enter the market.
Related Reading
Ted also stated that ETH’s current performance “feels like it’s trading like the 2016-17 cycle.” At the time, Ethereum consolidated for around a year and dropped below the range’s key support level for a few weeks before surging to new highs.
ETH has been “consolidating for a year now and recently broke below a key support level,” suggesting that the latter half of 2025 could be bullish for the cryptocurrency if history repeats.
As of this writing, Ethereum trades at $1,947, a 4.47% increase in the daily timeframe.
Featured Image from Unsplash.com, Chart from TradingView.com