
Reason to trust
Strict editorial policy that focuses on accuracy, relevance, and impartiality
Created by industry experts and meticulously reviewed
The highest standards in reporting and publishing
Strict editorial policy that focuses on accuracy, relevance, and impartiality
Morbi pretium leo et nisl aliquam mollis. Quisque arcu lorem, ultricies quis pellentesque nec, ullamcorper eu odio.
Bitcoin (BTC) has failed to reclaim $84,000 resistance again and has fallen 4% to retest another crucial support zone. Some analysts suggested that the cryptocurrency’s rally will be determined by its weekly close, which could see BTC crash or climb to new levels.
Related Reading
Bitcoin Hits $84,000 Wall Again
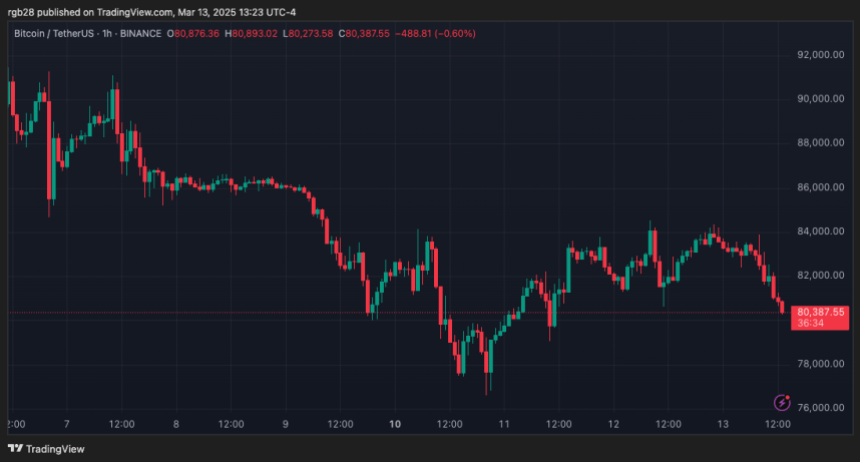
After losing the $84,000-$86,000 support zone on Sunday, Bitcoin has failed to reclaim this level. The flagship crypto has retraced over 11% in the past week, briefly falling to a 4-month low of $76,600 on Monday.
Since then, BTC’s price has hovered between the $80,000-$84,000 range, failing to break above the range’s upper zone for the past four days. Crypto analyst Jelle noted that this resistance level has been a key level throughout the first half of March.
Notably, the $84,000 mark served as an important bounce level during the start-of-month price pump and correction, and “reclaiming it will make all the difference for how the rest of the month goes.”
Bitcoin has attempted to regain this level in the past 24 hours, climbing to $83,900 on Thursday morning. To the analyst, a reclaim of $84,000 could propel the price back to the post-election breakout range, and things would “get real interesting.”
Ali Martinez pointed out that the biggest supply barrier for Bitcoin sits at the $95,000 range, where 1.2 million investors purchased 726,000 BTC.
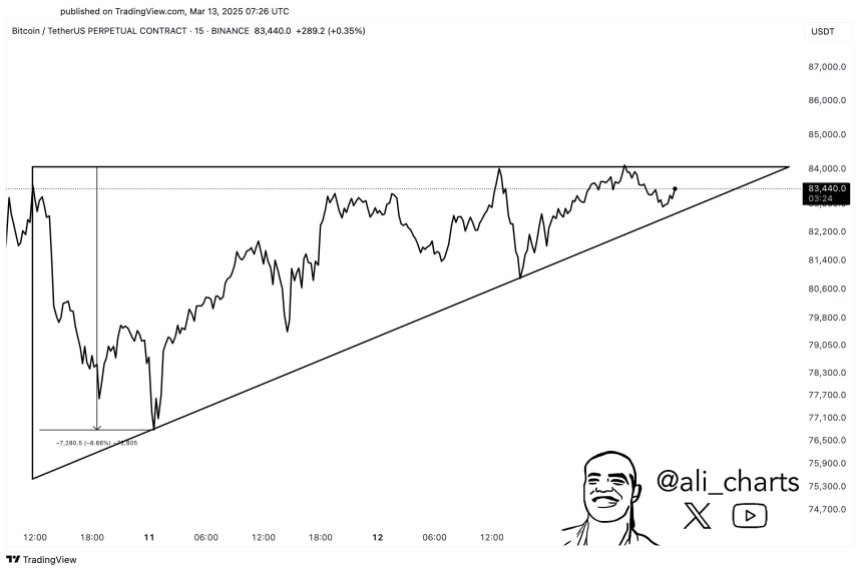
He also noted that the largest cryptocurrency by market capitalization is consolidating within an ascending triangle, which could lead to a 9% surge to the $90,000 mark if it breaks out above $84,000.
Nonetheless, BTC failed to reclaim this key resistance and retraced to the $80,000 support zone. Jelle warned that “bulls need to defend the current area, or this could cascade towards the high seventies once more.”
Is BTC’s Cycle Top Or Bottom In?
Ted Pillows suggested that BTC is poised for another leg up as its price action resembles previous performances. He highlighted that Bitcoin has held its ascending support trendline like in 2017 and 2020, which “shows that the cycle isn’t over yet.”
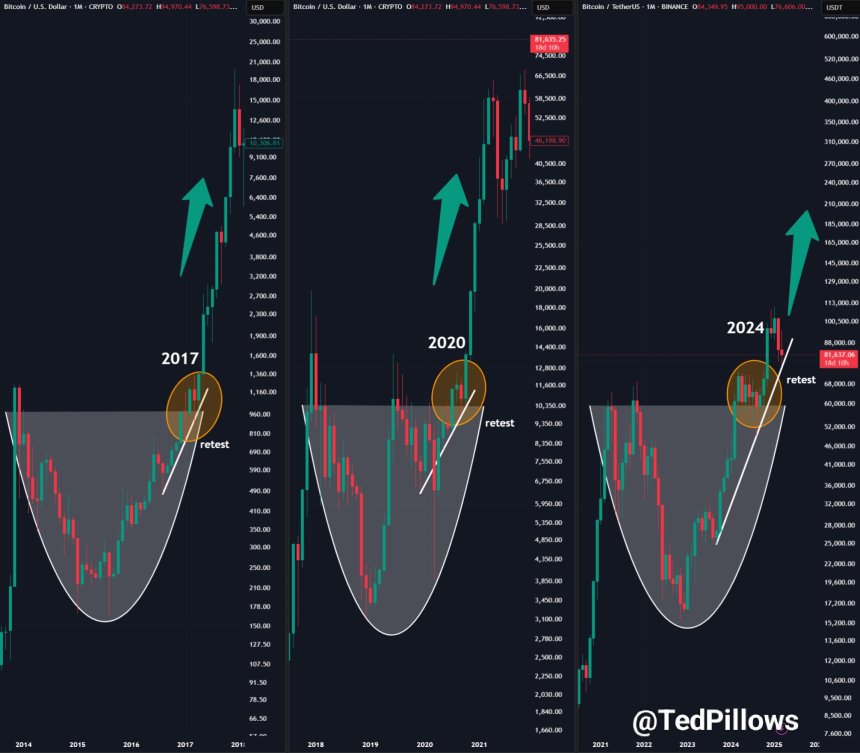
Based on this historical price performance, the analyst considers that the cryptocurrency could retest the $72,000-$74,000 support before a local bottom is in. “After that, there’ll be some consolidation followed by the next leg up,” he explained.
Trader Titan of Crypto pointed at a potential reversal as BTC is “showing signs of bottoming on the weekly chart” with the Relative Strength Index (RSI) as support, an Oversold Stochastic RSI bullish crossover, and price at the lower Bollinger Band. He also noted that BTC’s price action resembles 2020’s market structure before a major breakout.
Related Reading
Meanwhile, analyst Nebraskangooner affirmed that Bitcoin has been “historically predictable,” which suggests that its weekly close range will be key for the next move. According to the post, if BTC closes the week below $67,250, it would potentially indicate the market has already hit the top, as it would become a distribution range.
The analyst explained that the cryptocurrency has respected the “distribution, accumulation, and instant reversal” levels in every BTC bear market. If Bitcoin remains “historically predictable,” the cryptocurrency could fall to levels not seen since late 2023 and early 2024.
As of this writing, BTC trades at $80,810, a 3.4% decline in the daily timeframe.
Featured Image from Unsplash.com, Chart from TradingView.com