Close Menu
    What's Hot

    Whales lose SYRUP sweet tooth despite Maple Finance’s growth

    Ethereum Prepares For A Parabolic Move – ETH/BTC Chart Signals Strong Bullish Setup

    Ethereum Enters Strategic Pause: Will Accumulation Below Resistance Spark A Surge?

    Facebook X (Twitter) Instagram
    yeek.io
    • Crypto Chart
    • Crypto Price Chart
    X (Twitter) Instagram TikTok
    Trending Topics:
    • Altcoin
    • Bitcoin
    • Blockchain
    • Crypto News
    • DeFi
    • Ethereum
    • Meme Coins
    • NFTs
    • Web 3
    yeek.io
    • Altcoin
    • Bitcoin
    • Blockchain
    • Crypto News
    • DeFi
    • Ethereum
    • Meme Coins
    • NFTs
    • Web 3
    Meme Coins

    Pepe coin price forms bullish patterns as CEX outflows rise

    Yeek.ioBy Yeek.ioMarch 17, 2025No Comments2 Mins Read
    Share Facebook Twitter Pinterest Copy Link Telegram LinkedIn Tumblr Email
    Share
    Facebook Twitter LinkedIn Pinterest Email

    Pepe coin price held steady on Monday as centralized exchange outflows rose after forming several bullish patterns. 

    Pepe (PEPE) rose to $0.000070, up by about 35% from its lowest level this year, giving it a market cap of $2.9 billion. 

    Data from Nansen shows that many investors are moving their tokens from exchanges to self-custody. Tokens held on exchanges dropped to 240.15 trillion, down 1.21% from last week.

    Increased exchange outflows are generally seen as a positive sign since they suggest that investors are holding onto their coins rather than selling. Exchange outflows often slow during a strong downward trend as investors panic and sell off their holdings.

    Technicals suggest that Pepe price may soon surge. The four-hour chart below shows that it has formed a small inverse head and shoulders pattern. This pattern’s head is at this month’s low of $0.000005245, while the neckline is at $0.000007415. 

    An inverse H&S is a bullish signal. A move above the neckline could lead to further gains, with the next key resistance at $0.000008915 — the highest swing on March 2.

    Pepe price chart | Source: crypto.news

    Pepe coin price formed a bullish divergence
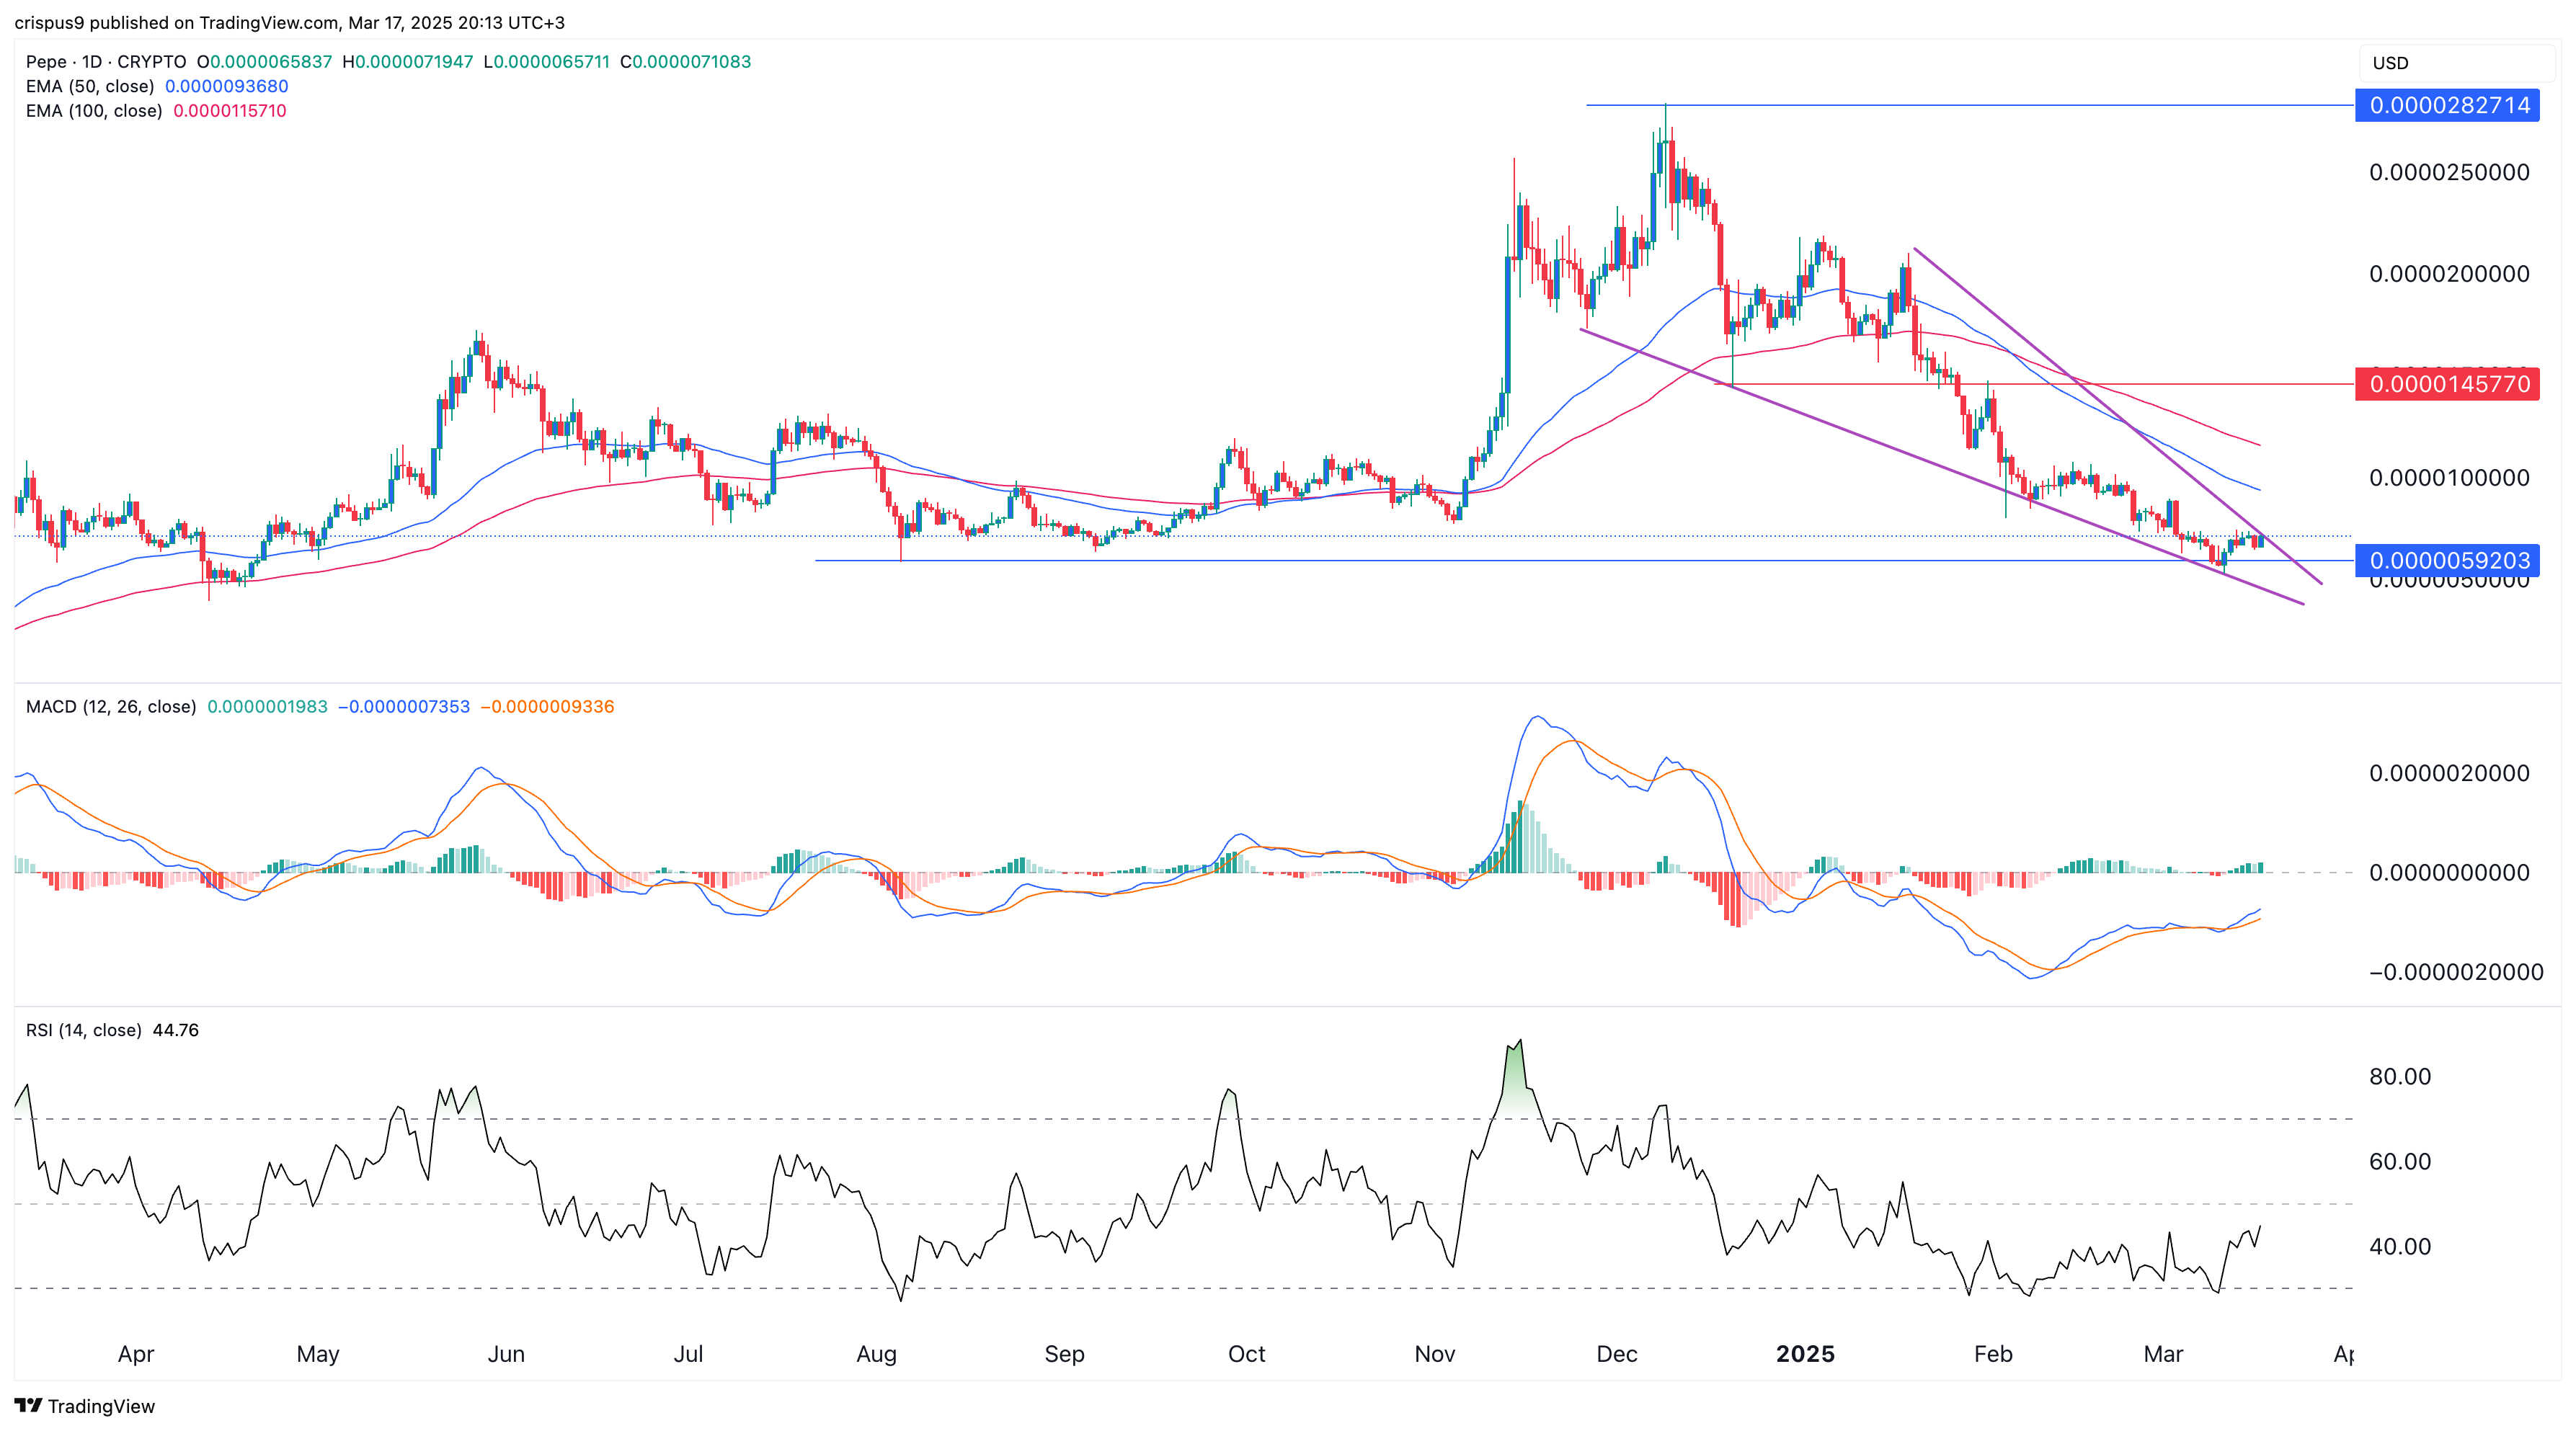
    Pepe coin price
    Pepe chart | Source: crypto.news

    The daily chart shows that Pepe has also formed a double-bottom pattern at $0.00005920. This pattern consists of two down peaks and a neckline at $0.00002827, one of the most bullish reversal formations in technical analysis.

    The Relative Strength Index and the MACD indicators have formed a bullish divergence. This occurs when an asset’s price is falling while oscillators are rising — a sign that momentum is turning positive.

    Pepe has also formed a falling wedge pattern, defined by two descending and converging trendlines. This setup suggests that the coin could experience a bullish breakout in the coming days.

    The initial target will be the psychological level at $0.000010. A break above that could push Pepe toward $0.00001457, its lowest swing on December 20. However, a drop below the year-to-date low of $0.0000053 would invalidate the bullish outlook.

    Follow on Google News Follow on Flipboard
    Share. Facebook Twitter Pinterest LinkedIn Tumblr Email Copy Link
    Previous ArticleMemecoin Insider Creates Wolf of Wall Street-Inspired Coin Despite Potential Interpol Warrant: Report
    Next Article Aave V3 is Now Live on Celo
    Avatar
    Yeek.io
    • Website

    Yeek.io is your trusted source for the latest cryptocurrency news, market updates, and blockchain insights. Stay informed with real-time updates, expert analysis, and comprehensive guides to navigate the dynamic world of crypto.

    Related Posts

    Dogecoin faces a sell wall – Will smart money hold or fold at $0.17?

    June 7, 2025

    Analyzing Dogecoin’s price recovery odds in the wake of Trump-Musk spat

    June 7, 2025

    Examining PENGU’s 9% pump – Will spot sell pressure ruin the bullish setup?

    June 7, 2025
    Leave A Reply Cancel Reply

    Advertisement
    Demo
    Latest Posts

    Whales lose SYRUP sweet tooth despite Maple Finance’s growth

    Ethereum Prepares For A Parabolic Move – ETH/BTC Chart Signals Strong Bullish Setup

    Ethereum Enters Strategic Pause: Will Accumulation Below Resistance Spark A Surge?

    Solana indicators point north, bulls test $165 target

    Popular Posts
    Advertisement
    Demo
    X (Twitter) TikTok Instagram

    Categories

    • Altcoin
    • Bitcoin
    • Blockchain
    • Crypto News

    Categories

    • Defi
    • Ethereum
    • Meme Coins
    • Nfts

    Quick Links

    • Home
    • About
    • Contact
    • Privacy Policy

    Important Links

    • Crypto Chart
    • Crypto Price Chart
    © 2025 Yeek. All Copyright Reserved

    Type above and press Enter to search. Press Esc to cancel.