 price up today?")
Ether (ETH) price rallied nearly 8% over the past 24 hours, reaching a high of $2,064 on March 19. The altcoin’s daily trading volume increased to $17.4 billion as ETH regained a position above the $2,000 level.
Ethereum 1-hour chart. Source: Cointelegraph/TradingView
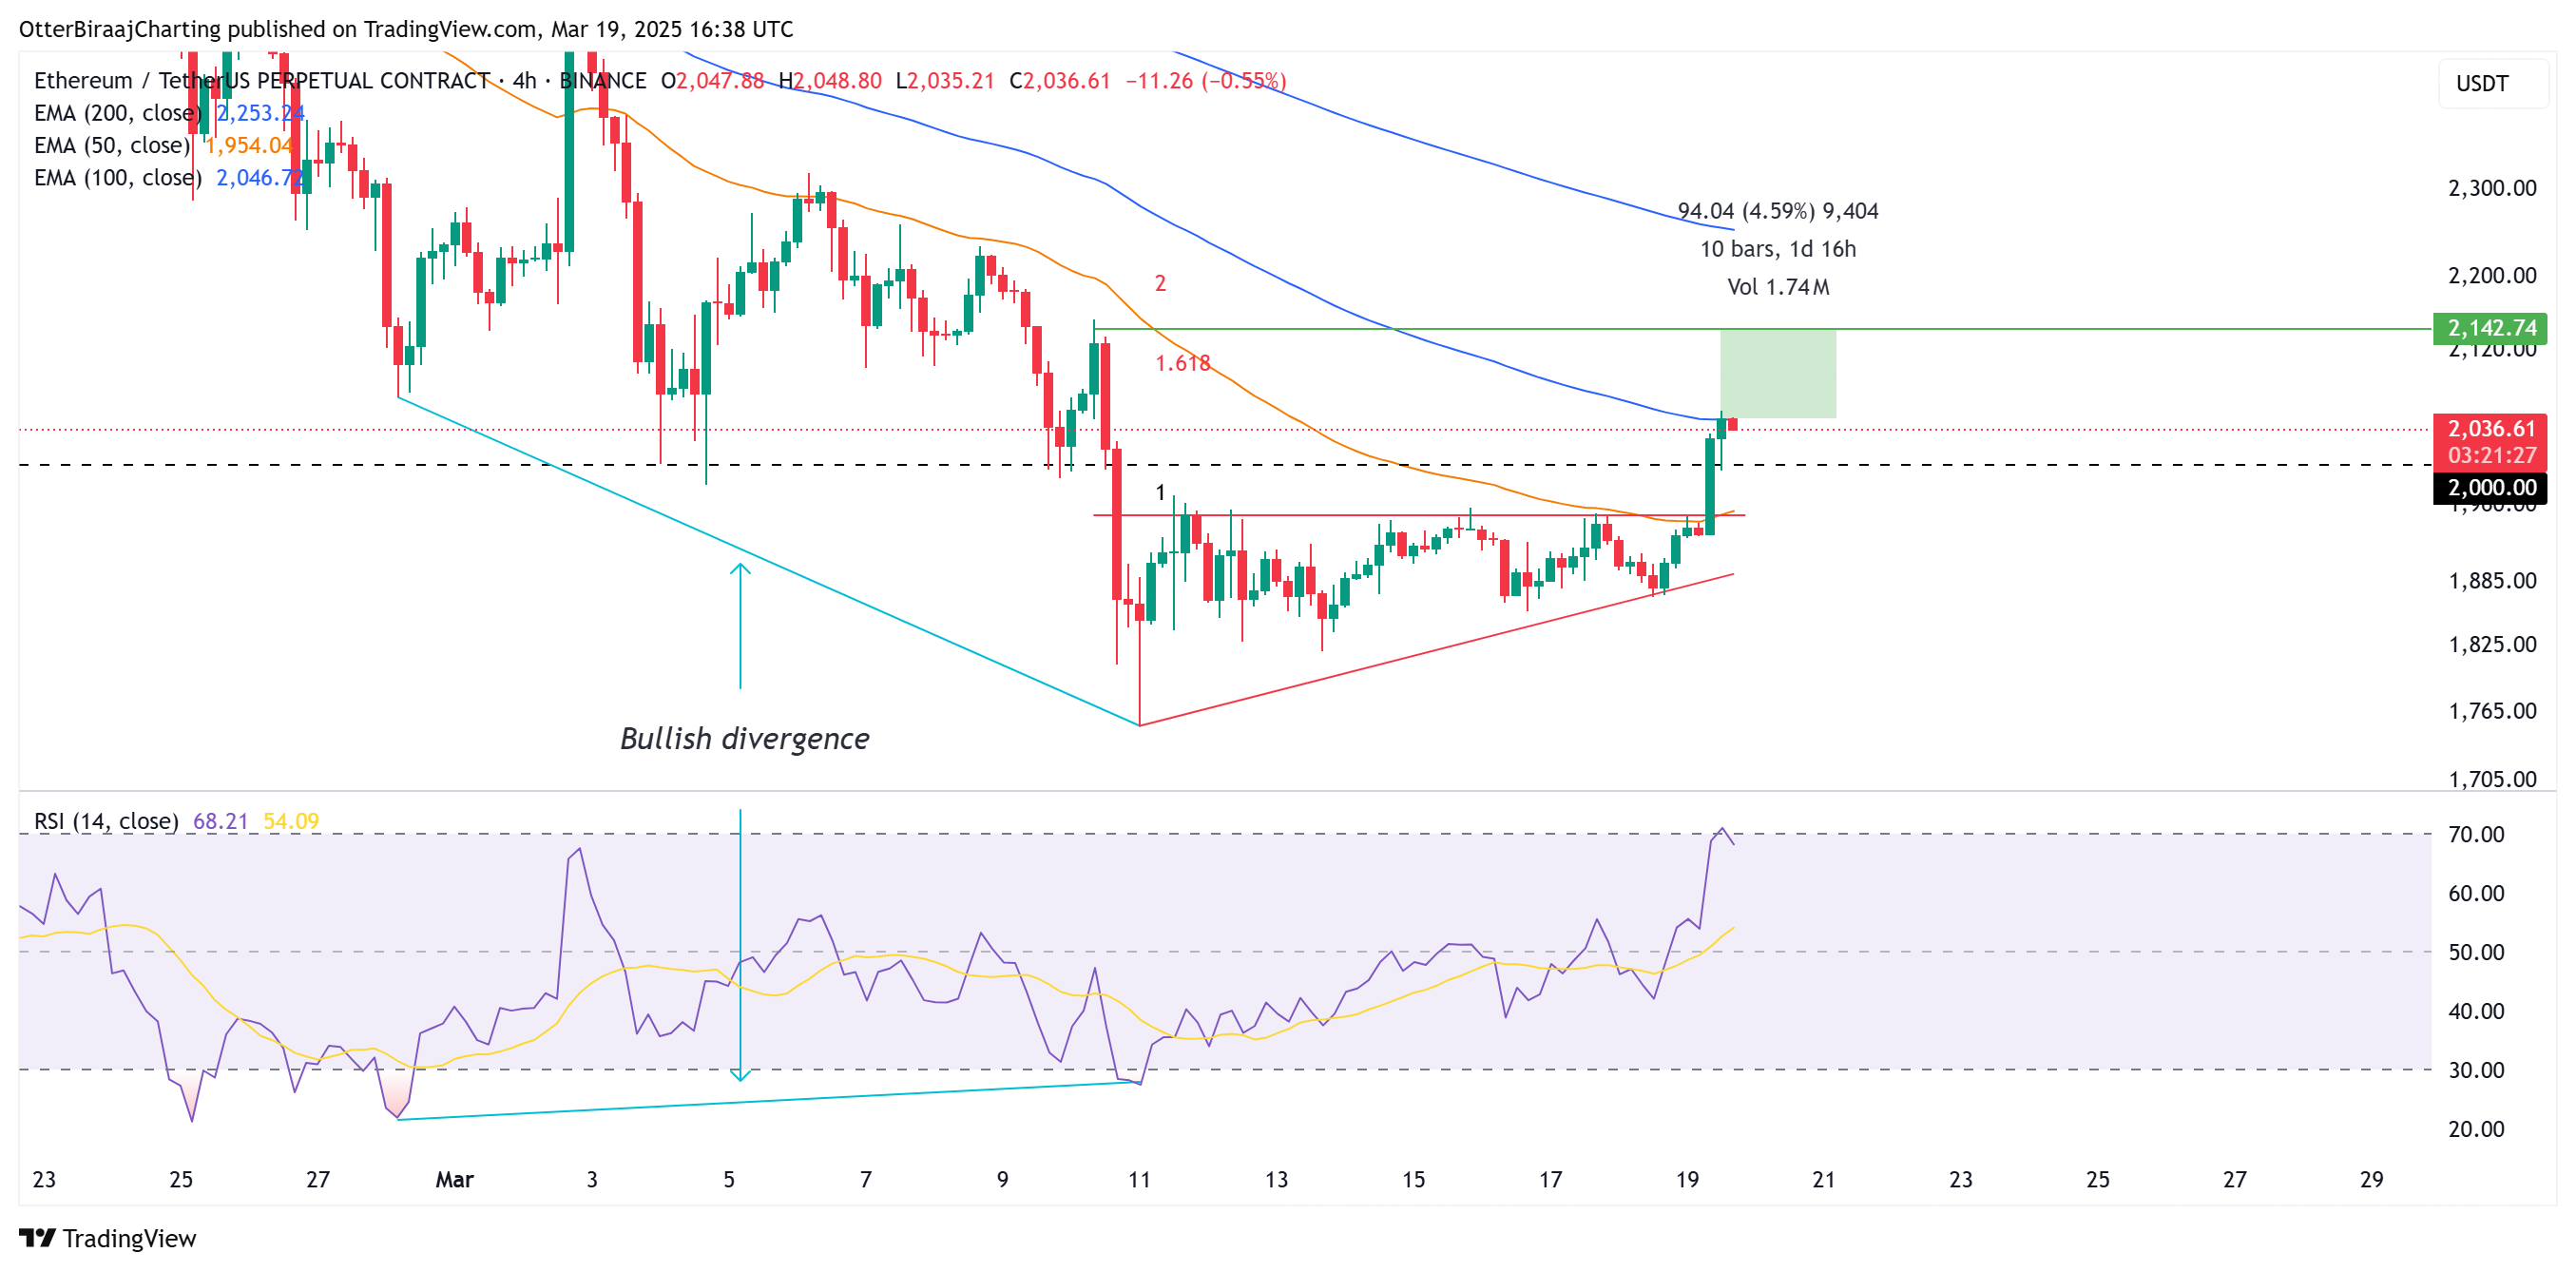
ETH exhibits an ascending triangle breakout
Ether price is up today after the altcoin managed a successful breakout from an ascending triangle pattern. After falling below $2,000 on March 10, Ether formed higher lows, followed by multiple retests at the immediate resistance of $1,950, which was the pattern’s neckline.
A bullish divergence also took shape between the price and relative strength index (RSI), preceding a local bottom at $1,752. Such technical setups indicate that the bullish momentum is taking charge against the bearish trend.
Bitcoin 4-hour chart. Source: Cointelegraph/TradingView
With a confirmed bullish breakout taking place from the triangle pattern, the technical targets remain at $2,142, which is roughly 5% from ETH’s current price. However, the 100-day exponential moving average (blue line) is providing resistance at $2,050, which needs to be flipped into support for prices to target $2,142.
Rekt Capital, an anonymous crypto analyst, highlighted that ETH recently tested its multi-year demand zone under the $2,000 level. With respect to a bullish reversal, the trader said,
“If price can generate a strong enough reaction here, then ETH will be able to reclaim the $2196-$3900 Macro Range (black).”
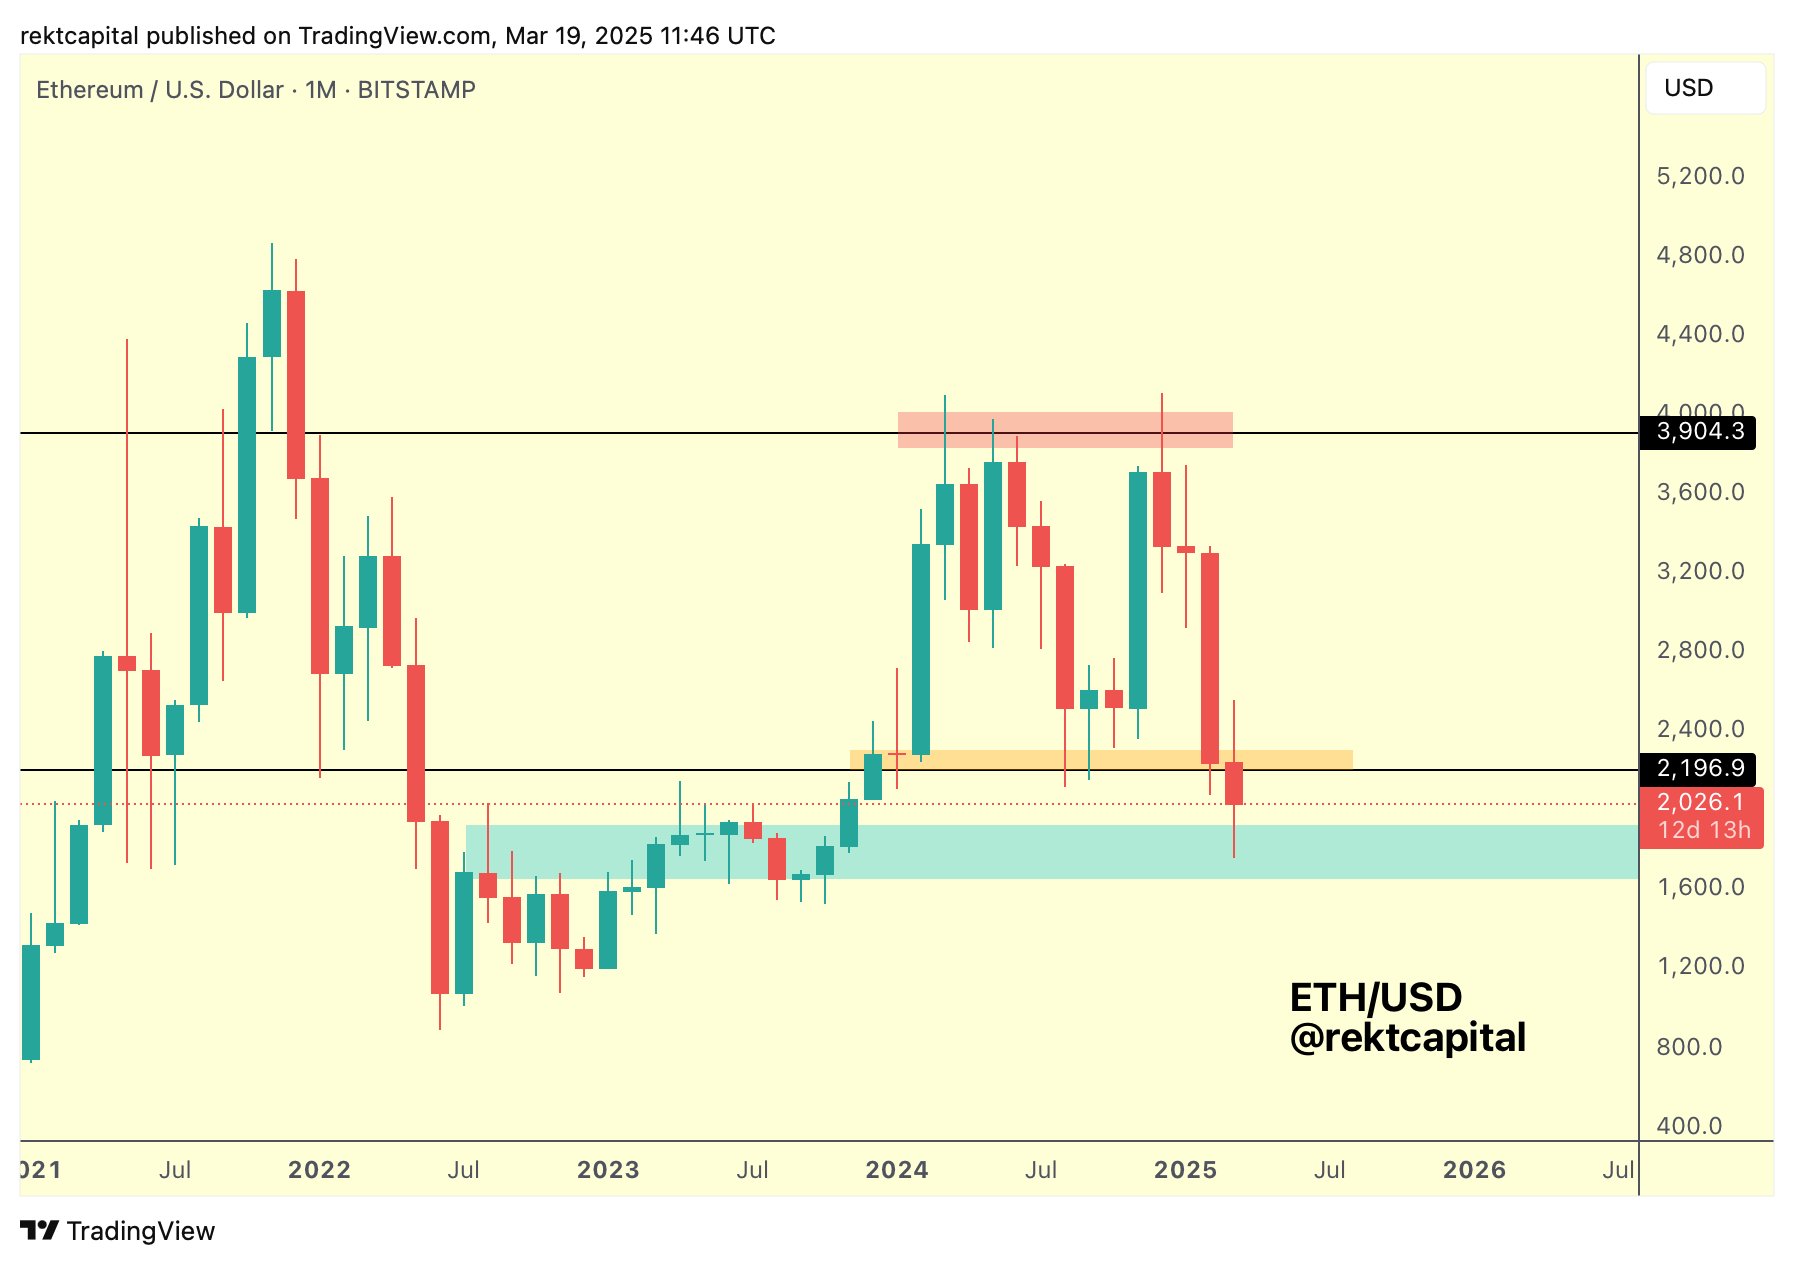
Ethereum monthly analysis by Rekt Capital. Source: X.com
Related: ETH price prospects dim as Ethereum DEX volumes drop 34% in a week
Ethereum flows to accumulation address hit new highs
Irrespective of recent price corrections, ETH accumulation addresses have been stockpiling at a significant rate. On March 12, Ether inflows into ETH accumulation addresses hit a one-day record at 345,210 ETH.
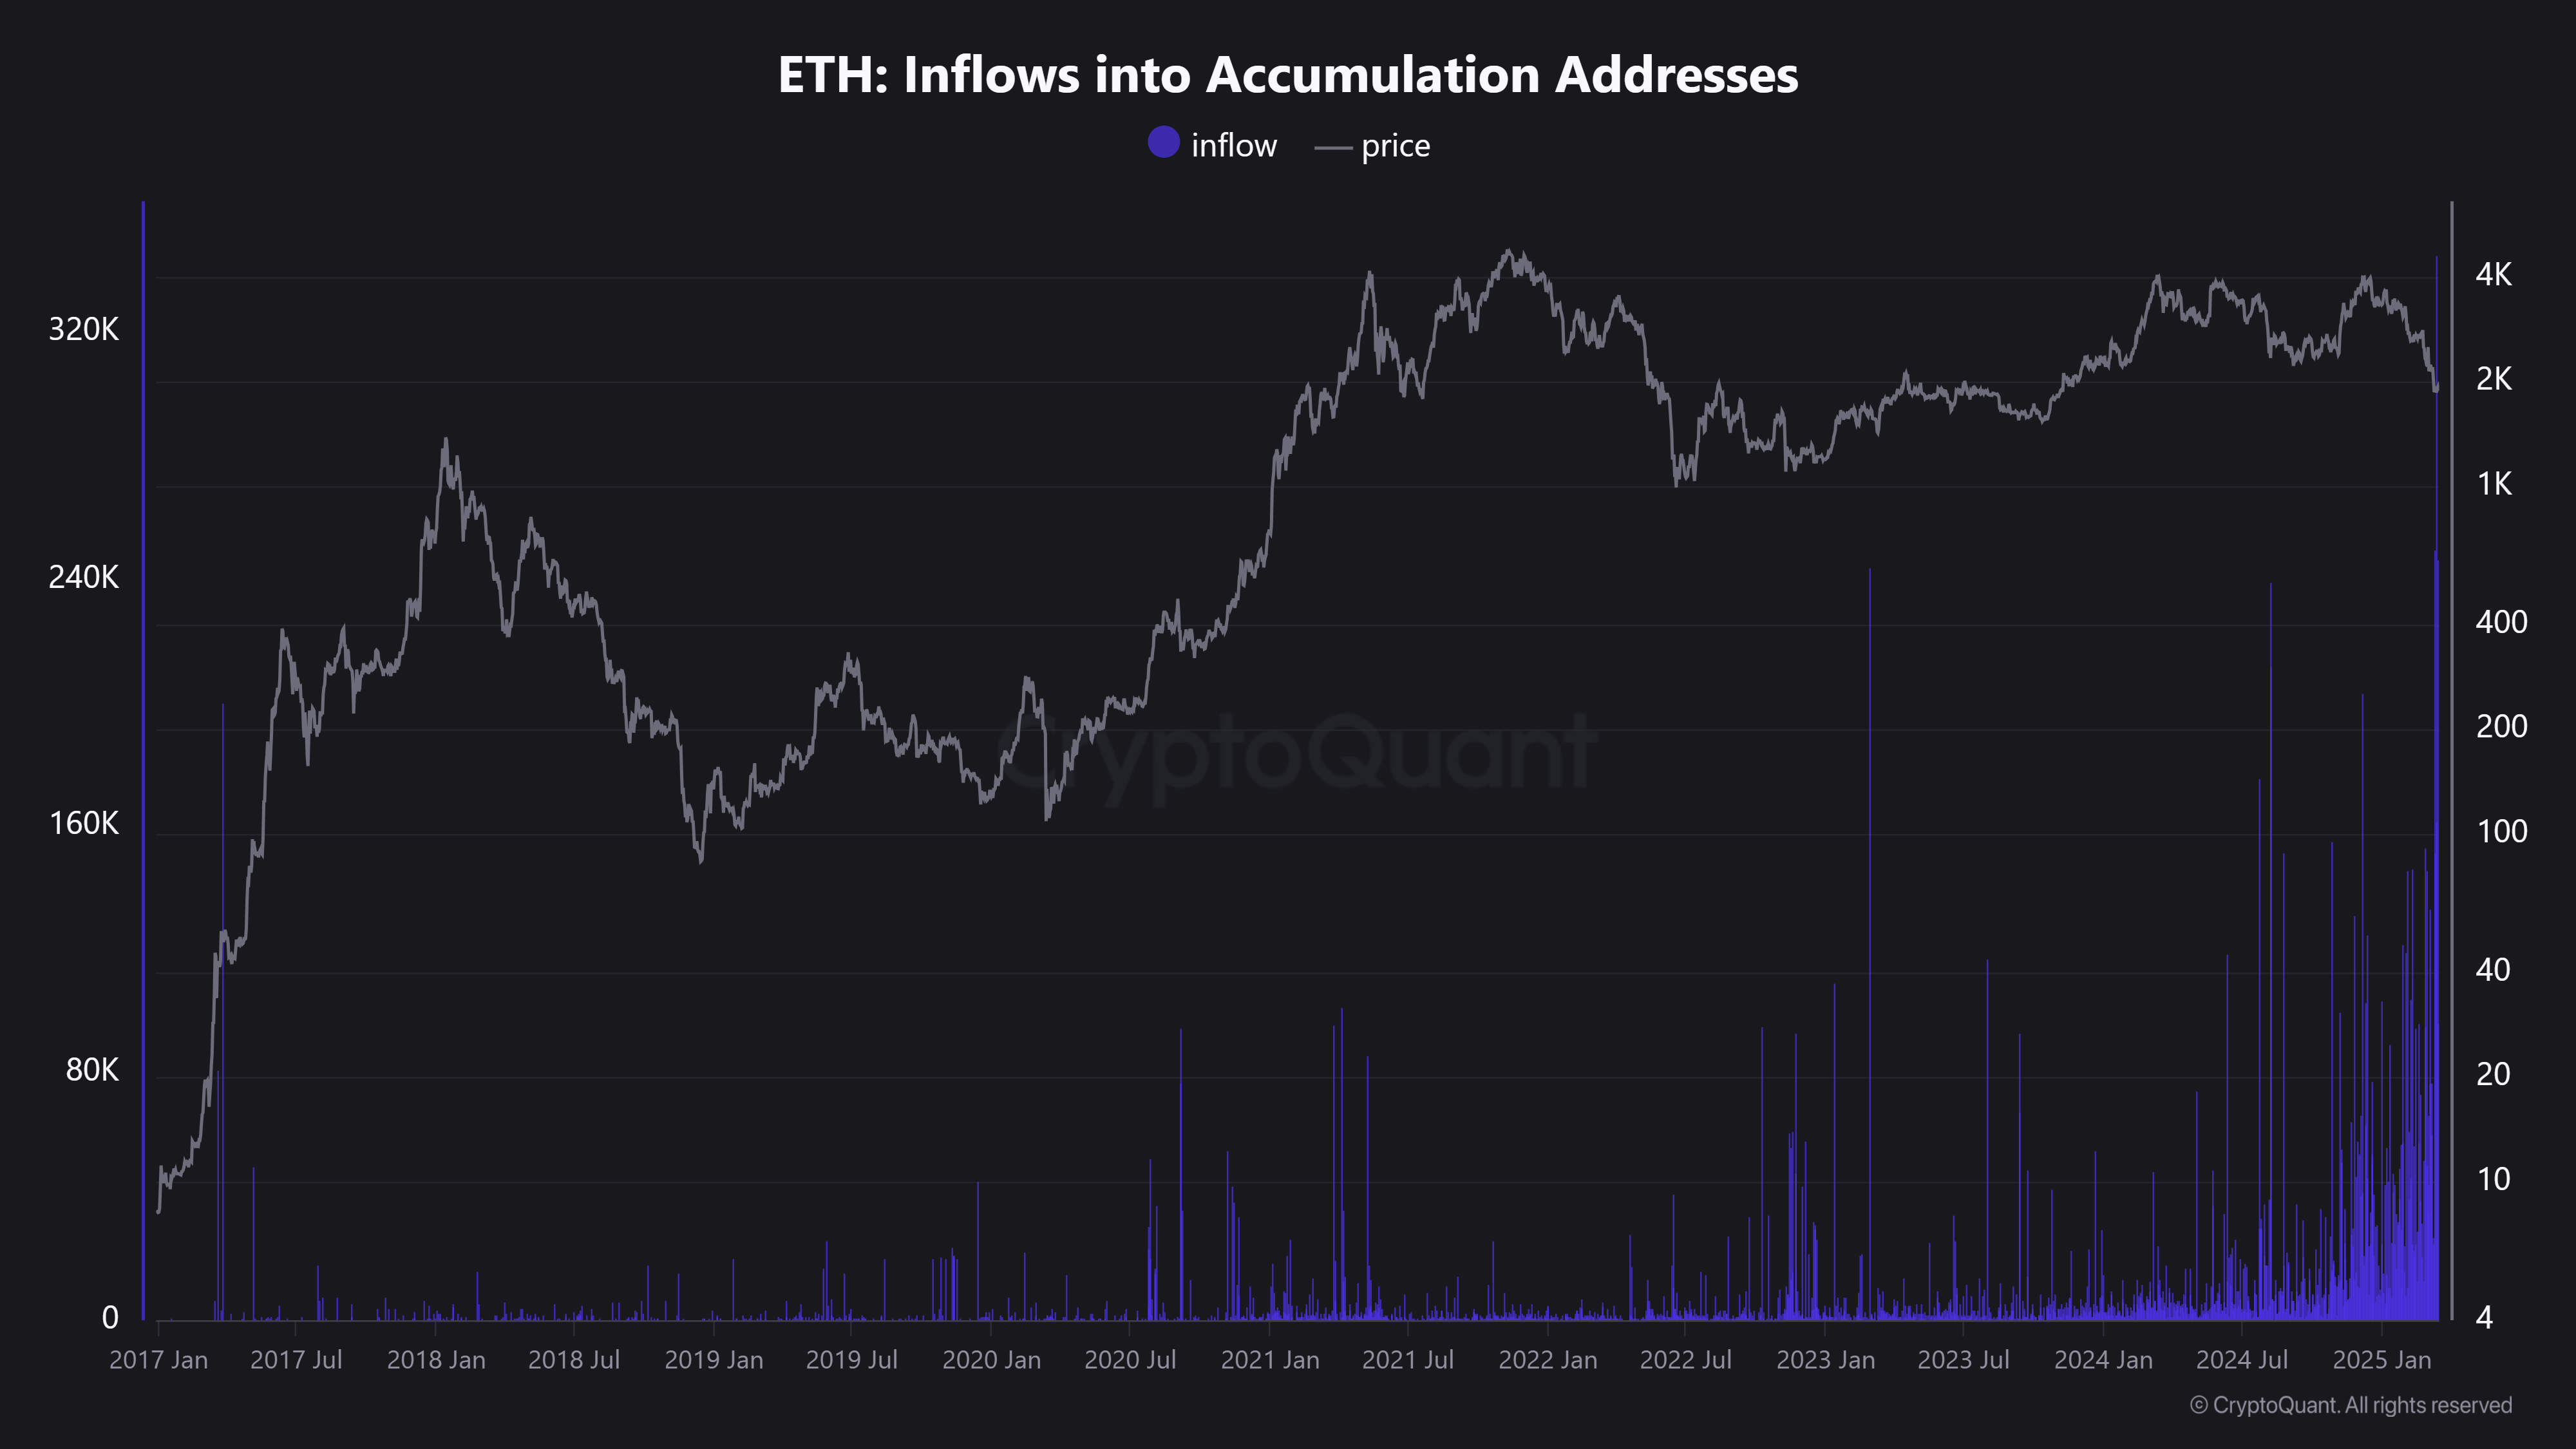
ETH inflows into accumulation addresses. Source: CryptoQuant
Ethereum accumulation addresses are a specific classification of wallet addresses used to track long-term holding behavior in the Ethereum network. These addresses usually have no outgoing transactions, meaning the ETH is not used for spending or transferred out.
In 2024, these addresses amassed over 5.8 million ETH across a 12-month period. In 2025, the accumulation rate has significantly increased, with the same addresses acquiring 4.73 million ETH in under three months.
Onchain data shows that large holders are potentially taking advantage of ETH’s low price by adding the altcoin at a discount which is currently 58.4% below its all-time high.
This article does not contain investment advice or recommendations. Every investment and trading move involves risk, and readers should conduct their own research when making a decision.