
- Dogecoin’s price struggled at $0.18 support—whales and network activity may signal a breakout.
- MACD and RSI showed bearish trends—if DOGE fails to break $0.29, further declines are likely.
Dogecoin [DOGE] has shown mixed price action recently, following a correction that wiped out its earlier gains.
Priced at $0.1681 at press time, Dogecoin has a 24-hour trading volume of $844 million, reflecting a -0.43% change in the last 24 hours, but a 3.24% increase over the past week.
Although Dogecoin’s price has recently declined, there is cautious optimism that it could rally back to $0.29. This outlook is supported by key technical levels and market dynamics.
Dogecoin has faced multiple corrections, retreating from its recent highs. However, analysts believe $0.29 may be achievable in the short term.
The prediction hinges on DOGE’s proximity to the 20-day Exponential Moving Average (EMA), which could act as a support level for future price movement.
Traders are closely monitoring this level for signs of stability, which might indicate a potential rally. However, if DOGE fails to break above the EMA, further declines could follow.
According to Igor Bondarenko, if DOGE struggles to gain momentum at this level, the price may drop as low as $0.10, presenting a bearish scenario for the cryptocurrency.
Bearish momentum in MACD and RSI
At the time of writing, the MACD indicator was showing a bearish trend for Dogecoin. The MACD line (blue) was below the signal line (orange), suggesting a lack of upward momentum.
Additionally, the histogram remains mostly negative, reinforcing the prevailing weakness in the market.
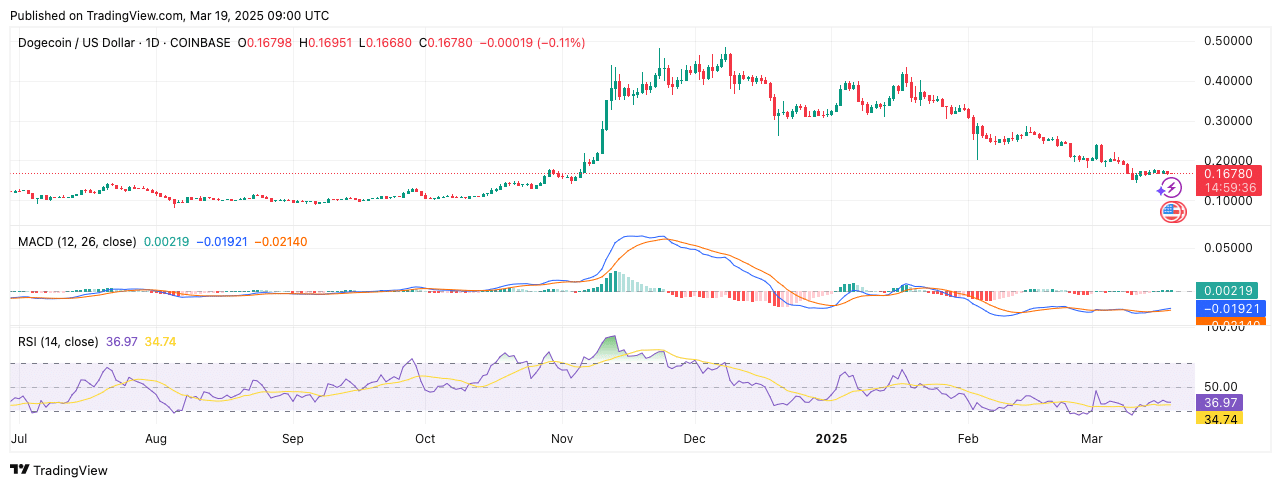
Source: TradingView
The RSI was at 36.97, just below the neutral 50 mark. This level suggests that DOGE is in the oversold region, which might signal further selling pressure if it continues to drop below 30.
If the RSI remains under 40, the market could experience continued weakness, potentially leading to further corrections.
Whale activity and network participation
Despite the bearish signals, Dogecoin’s network has shown increased activity. According to crypto analyst Ali Martinez, there has been a notable surge in active addresses, rising from 150,000 on the 12th of March to over 280,000 by the 14th of March.
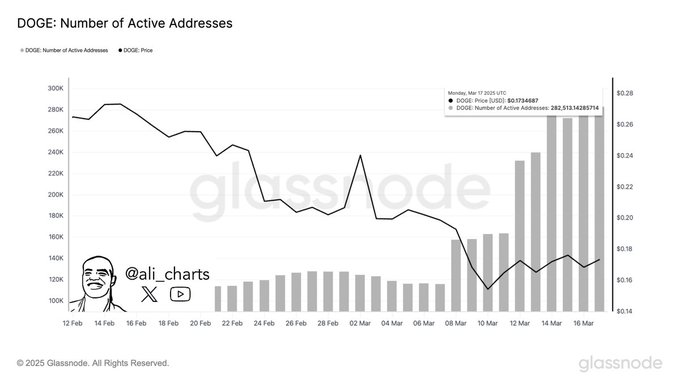
Source: X
The spike in activity coincided with a price increase from $0.16 to $0.26, suggesting that higher network participation drove demand.
However, the price later retraced, indicating that the initial enthusiasm waned.
Additionally, large transactions surged as whales bought over 110 million DOGE within a week. This influx of major players supported a short-term bullish trend but also hinted that some buying pressure was temporary.
The subsequent price retracement suggests that profit-taking or market corrections may have influenced the downturn.
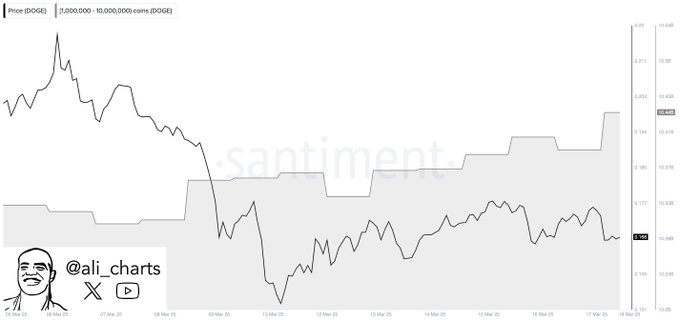
Source: X
Resistance and support levels
As Dogecoin moves through this phase of uncertainty, key resistance and support levels are crucial. The price reached $0.202 on the 6th of March, which remains a strong resistance level.
A break above this level could signal a continuation of the bullish trend, but failure to do so may lead to further consolidation or declines.
On the downside, $0.18 has emerged as a critical support level for Dogecoin. If the price breaks below this level, it could suggest a bearish market shift and lead to further downside pressure.
Finally, as the market remains volatile, the coming days will be crucial in determining Dogecoin’s next major move.