
Reason to trust
Strict editorial policy that focuses on accuracy, relevance, and impartiality
Created by industry experts and meticulously reviewed
The highest standards in reporting and publishing
Strict editorial policy that focuses on accuracy, relevance, and impartiality
Morbi pretium leo et nisl aliquam mollis. Quisque arcu lorem, ultricies quis pellentesque nec, ullamcorper eu odio.
Over the past few weeks, the Bitcoin price has not been able to sustain any meaningful momentum in the journey to recover its six-figure valuation. After falling to just above $81,000 on Tuesday, March 18, the flagship cryptocurrency pushed for the $87,000 mark before facing a significant level.
Below is why the $87,000 level could prove pivotal to the long-term health of the Bitcoin price.
5.58 Million BTC Addresses ‘Sitting On A Hot Potato’
In a March 21 post on the X platform, popular crypto analyst Maartunn discussed the significance of $87,000 as a crucial level for the future trajectory of the Bitcoin price. The reasoning behind this specific analysis is the average on-chain cost basis of several BTC investors.
Related Reading
Cost-basis analysis involves evaluating the capacity of a price level to act as either resistance or support based on the total amount of coins purchased in or around it. As observed in the chart below, the size of the dot reflects the number of coins bought within a particular price bracket. (hence the strength of the support or resistance area).
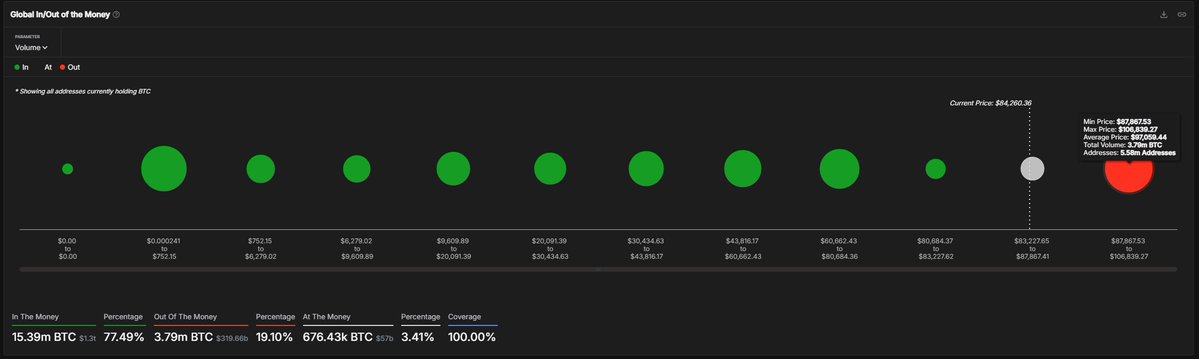
According to Maartunn, about 5.58 million addresses acquired 3.79 million BTC (worth $367 billion at an average price of $97,059) between the $87,867 – $106,839 region. The analyst noted that the investors here are “sitting on a hot potato” and in the red, as they all bought at prices well above the current price.
Typically, this $87,867 – $106,839 region serves as a crucial resistance area, as investors are likely to sell their assets should the Bitcoin price return to their cost basis. This selling activity would put some downward pressure on the premier cryptocurrency, hindering the further upward price movement.
Furthermore, Maartunn identified the investors within the $87,867 – $106,839 region as short-term holders, a class of investors known to be “fragile” and more reactive to slight market movements. Hence, the analyst noted that this might not be an ideal scenario, especially if the market sees another wave of bearish pressure.
Short-term holders have been associated with significant sell-off events (in reaction to price fluctuations). Ultimately, this implies that the Bitcoin market could experience a severe capitulation event if the short-term investors in the $87,867 – $106,839 region are forced to realize their losses.
Bitcoin Price At A Glance
As of this writing, the price of BTC is hovering around the $84,000 mark, reflecting no significant change in the past 24 hours.
Related Reading

Featured image from iStock, chart from TradingView