Reason to trust
Strict editorial policy that focuses on accuracy, relevance, and impartiality
Created by industry experts and meticulously reviewed
The highest standards in reporting and publishing
Strict editorial policy that focuses on accuracy, relevance, and impartiality
Morbi pretium leo et nisl aliquam mollis. Quisque arcu lorem, ultricies quis pellentesque nec, ullamcorper eu odio.
Tony “The Bull” Severino, a well-followed crypto analyst, recently took to the social media platform X to share a detailed breakdown of Bitcoin’s historical price behavior. The analysis uses a cyclical lens that many in the crypto community (both bulls and bears) agree holds significant relevance.
Notably, Tony Severino focuses on the concept of Bitcoin’s four-year cycles and how troughs and crests have consistently marked the periods of greatest opportunity and greatest risks for investing in Bitcoin. This analysis comes in light of Bitcoin’s recent price correction below $90,000 in March.
Cycles Define Sentiment: From Troughs Of Opportunity To Crests Of Risk
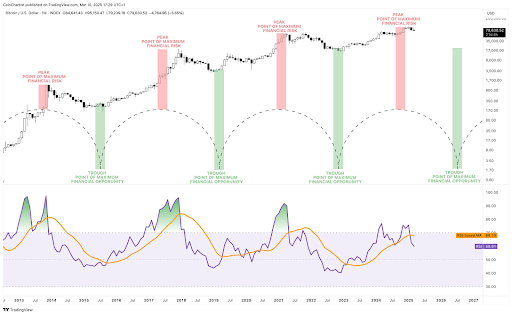
Severino’s analysis starts from a foundational belief shared across the crypto industry. The widely-held belief is that Bitcoin operates in clearly defined cycles, usually lasting around four years, mostly in relation to its halving cycles. His technical outlook is based on Bitcoin’s cycle indicator on the monthly candlestick timeframe chart that goes as far back as 2013.
Related Reading
As shown in the chart below, Bitcoin has gone through four definitive cycles in its history. These cycles, he explains, should be viewed from “trough to trough.” The troughs are the darkest moments in the market, but they also represent the point of maximum financial opportunity.

As these cycles progress, Bitcoin transitions through periods of increasing optimism, eventually arriving at what the analyst calls the “cyclical crest.” These crests, highlighted in red in his chart, are the periods where Bitcoin has reached its point of maximum financial risk. This is relayed in the ensuing price actions, with the Bitcoin price topping out right after passing each cyclical crest.
Bitcoin passed through its crest in the current market cycle just before reaching its all-time high of $108,786 in January 2025. If past cycles are any indication, the coming months could reveal whether a top is already in.
Right-Translated Peaks: Is BTC Running Out Of Time In This Cycle?
Bitcoin has been on a correction path since February and is currently down by 20% from this $108,786 price high. The Bitcoin price has even gone ahead to correct as low as $78,780 in the second week of March, triggering reactions as to whether the crypto has already reached its peak price this cycle.
Related Reading
However, Bitcoin might not be in the woods yet, as not all crests are followed immediately by market tops. Severino pointed out that past cycles have featured “right-translated” peaks where Bitcoin continued to rise slightly even after crossing the crest. The 2017 bull run was the most right-translated, with price action staying strong for some time after the red-zone crest. In contrast, other cycles began reversing not long after reaching this point of maximum risk.
Bitcoin appears to have already passed the red crest based on Severino’s model, but this does not confirm a top is in just yet. Instead, it means that the margin for error is rapidly narrowing. The longer BTC continues to correct after this point, the more elevated the risk of a bearish phase becomes.
BTC is attempting to regain bullish momentum at the time of writing, trading at $87,300 after rising 3.6% in the past 24 hours. Many other analysts argue that the Bitcoin price could still chart higher territory this year before a definitive top is confirmed.
Featured image from iStock, chart from Tradingview.com

