
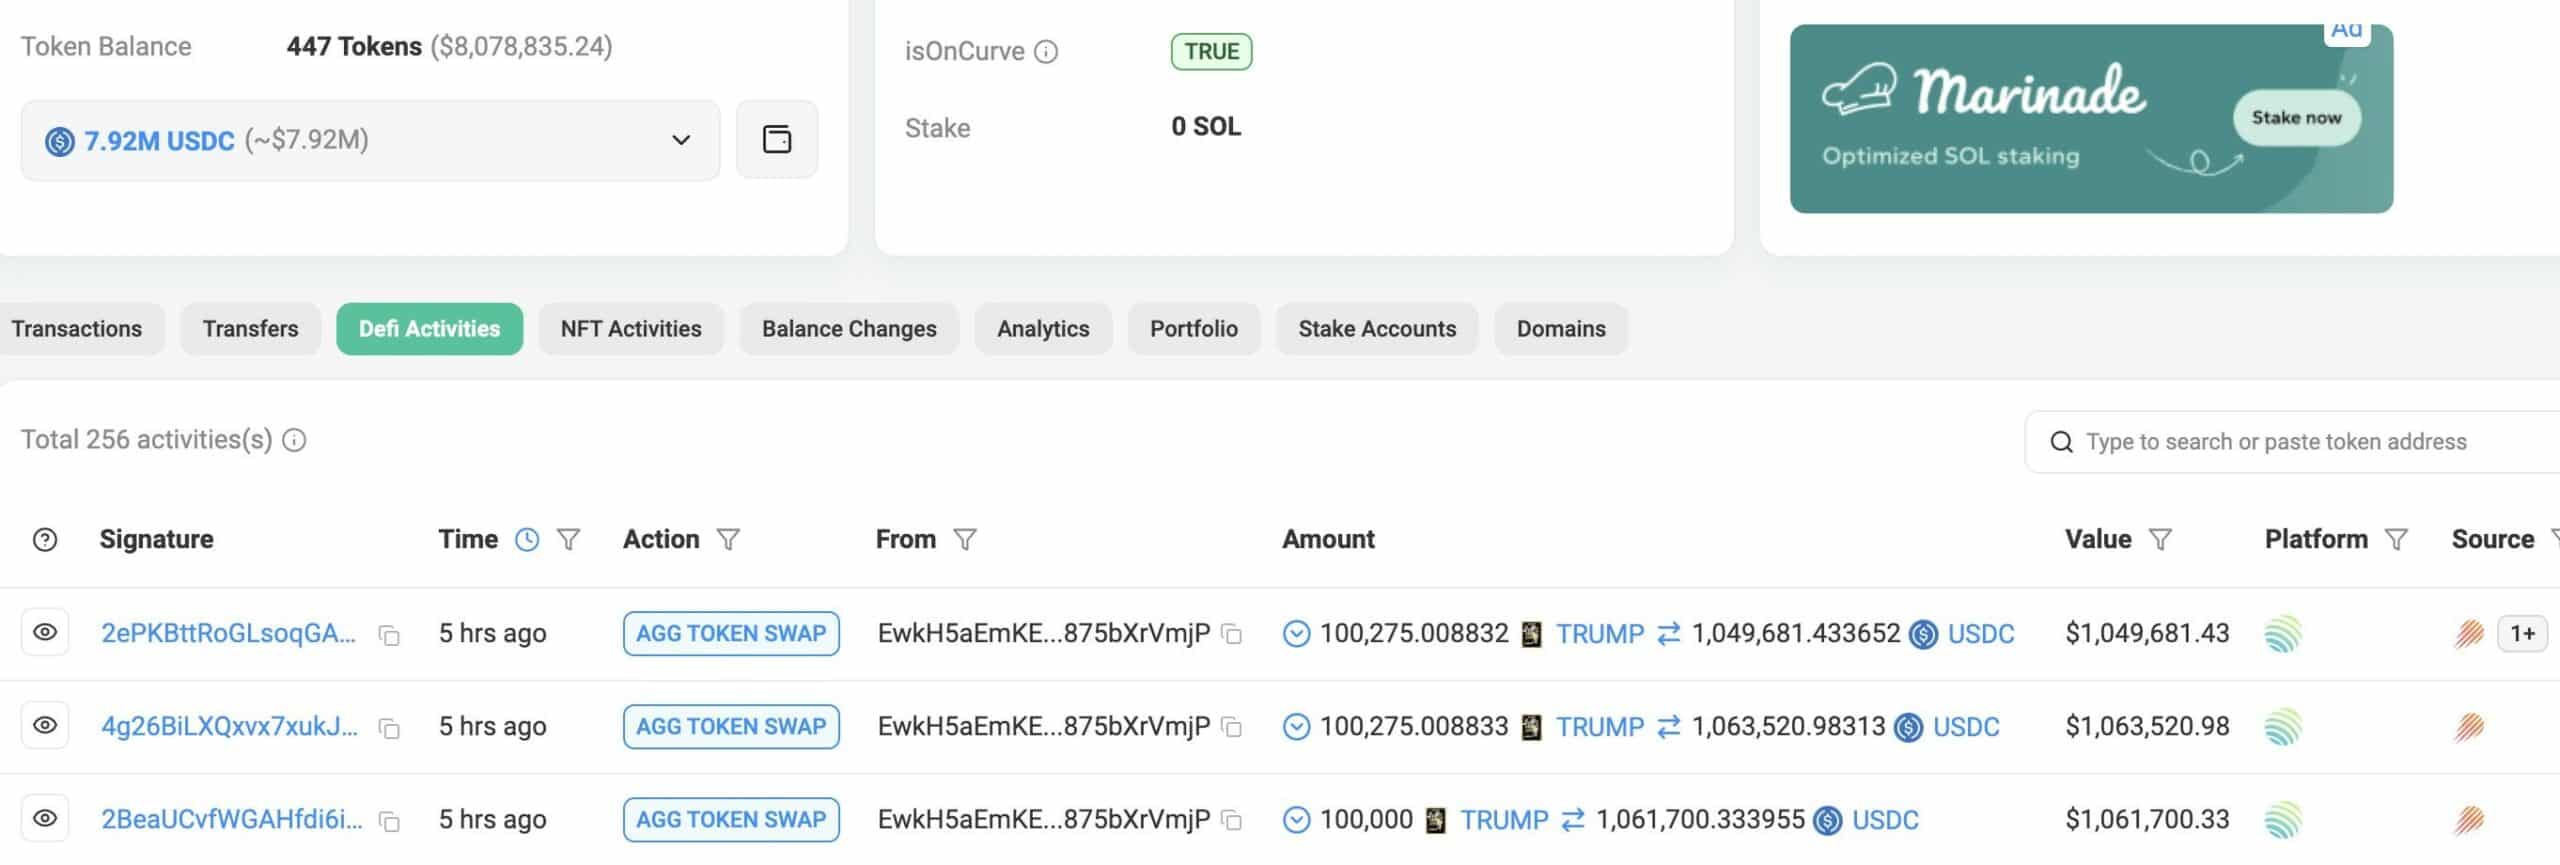
- A whale sold 743,947 TRUMP worth $7.92M at $10.66 – Taking another $3.3M loss on TRUMP
- Altcoin’s price fell by 8% as a triangle pattern broke and sellers gained more momentum
A whale is in the news today after it made a massive transaction, selling 743k TRUMP tokens for $7.92 million at $10.66. According to LookOnChain’s analysis, this resulted in a loss of $3.3 million.
The whale completed its third unsuccessful sale, thus accumulating $15.7M in losses since buying tokens for profit at first. Needless to say, these losses were a product of not just other sales in the memecoin’s market, but also market-wide price declines triggered by volatility.
The sale of TRUMP tokens by this particular holder triggered fear, especially among secondary holders who sold more tokens that intensified the market fall.
Market recovery, together with the entry of new investors, could stabilize the price of TRUMP, allowing for potential price recovery. However, the price drop could intensify if whales keep exiting the market and scare away minor investors.
TRUMP’s price performance and forecast
A 8% decline was seen on TRUMP/USDT’s charts when it penetrated through its ascending triangle support level which showed higher selling activities. The price position of $10.23 highlighted bearish continuation because the breakdown happened on the charts.
The price could find resistance at $9.56, with the same corresponding to a previous level of support. The MACD histogram demonstrated worsening negative momentum as the MACD line at -0.24 was below the Signal line located at -0.09. This confirmed an ongoing bear market trend.
The RSI value of 29.26 reached the oversold zone, suggesting potential stabilization if sellers cannot keep their dominance. Additionally, the structure break at $11.20 canceled out all previous ascent attempts, resulting in downward momentum.
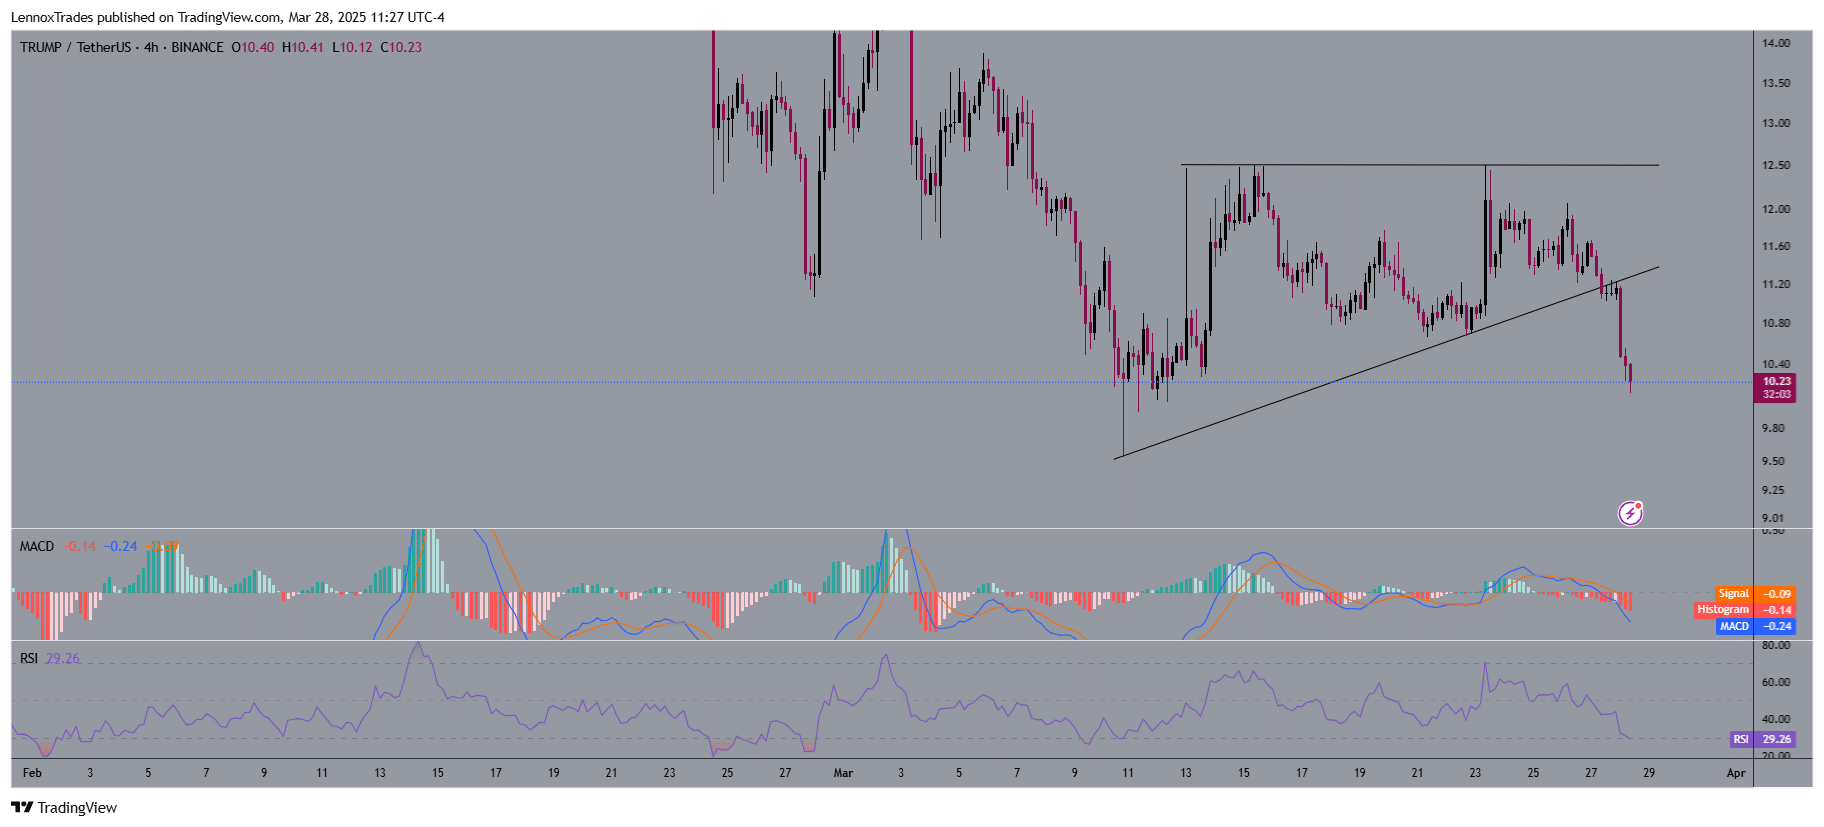
Source: TradingView
A price failure at $10.23 could trigger a possible price re-check of $9.56 – A previous demand zone. The price could likely challenge $11.20, followed by $12.50, if it recovers above $10.80 and breaks bearish momentum.
Further weakness might be likely only if buyers take control of higher prices. Confirmation of bearish momentum could happen if sustained selling pressure resists any expected short-term recovery.
Falling below $10.23 could trigger additional downfall. On the contrary, breaking through $11.20 could test bearish pressure.
Spot inflows and outflows on exchanges
Spot flows and the volume heatmap highlighted TRUMP’s activity across cryptocurrency exchanges. Binance led with $70.63M in volume and $148.45K in 12-hour positive net inflows.
Bybit followed with figures of $43.1M, OKX with $27.09M, Coinbase with $11.05M and Kraken with $5.08M.
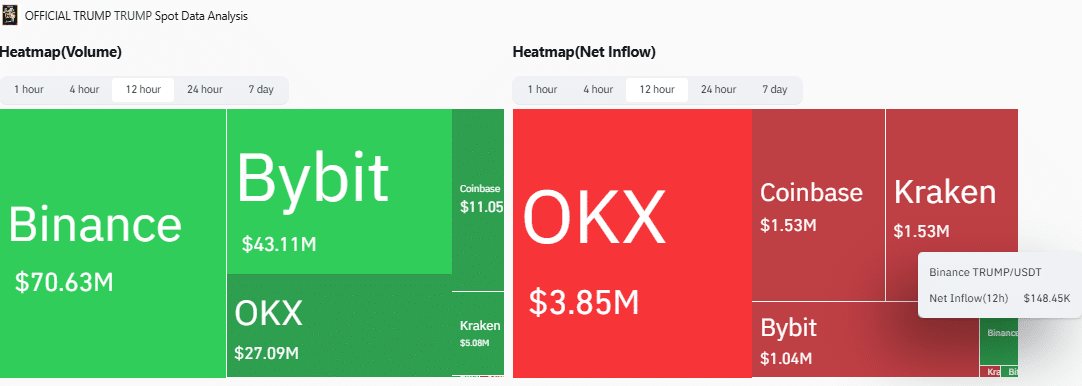
Source: Coinglass
As far as inflows were concerned, they were negative with -$1.53M for Coinbase and -$1.53M for Kraken, in addition to -$3.85M for OKX and -$1.04M for Bybit at press time. Strength of demand associated with Binance’s trading underlined positivity about TRUMP’s stability at $10.66.
To put it simply, the price trend is most likely to be stable with inflows unless selling pressure is compelled by draining funds from other exchanges and falling values. TRUMP investors may be faced with an uncertain position due to this mixed market action. Especially as the memecoin’s price might change depending on the status of its inflows.