
- BONK’s recent moves may face pressure as market conditions shift.
- The asset experienced a massive dump in the past day, and any further decline hinges on a key support zone.
Most market sentiment suggests that bulls could resume buying activity, which may help Bonk [BONK] recover from its recent losses.
BONK declined by 13.25% in the last 24 hours, as selling pressure across the market continues to increase. It may continue its downward trend if a key support level marked on the chart is breached.
Analysis by AMBCrypto indicates that the asset may recover from this slump and rebound to the upside, as several indicators currently lean more bullish than bearish.
BONK’s next move depends on support
BONK’s decline, as seen on the chart, began a day earlier when it traded into a key resistance zone, leading to the drop.
This movement has now brought the asset into another crucial support zone on the chart. If the price breaks below this level, BONK could decline by 25.80% to $0.00001043.
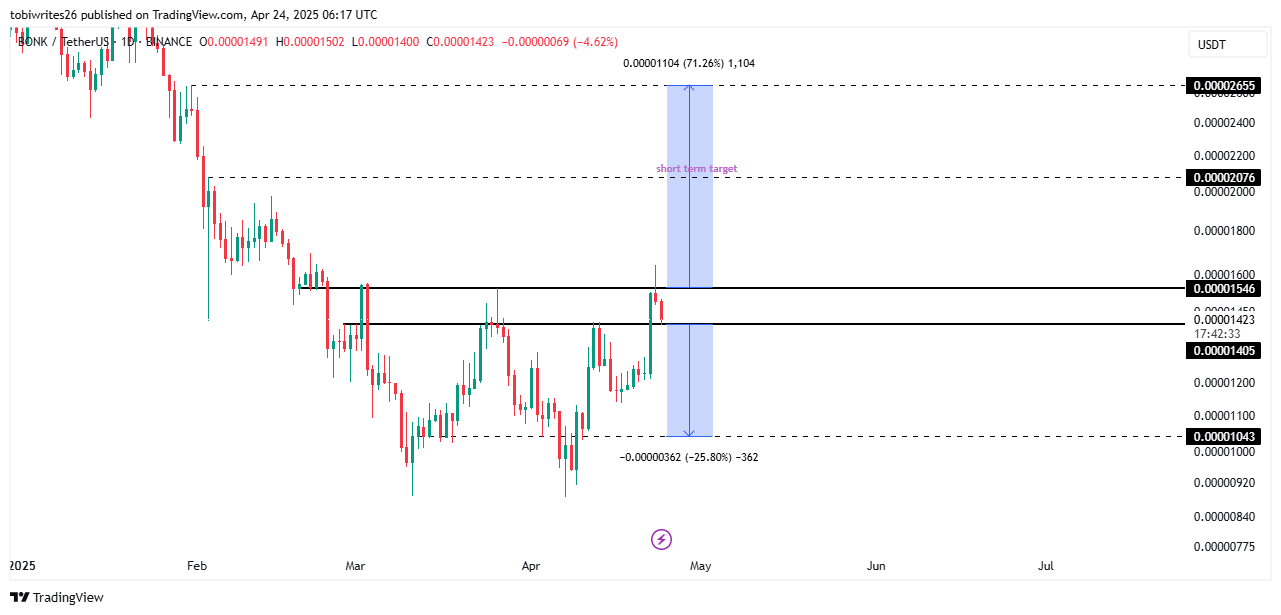
Source: TradingView
However, if buying sentiment remains strong, BONK could reverse course and rally by 71.26% to $0.00002655. A short-term bullish target would be at $0.00002076.
It’s also possible that the price consolidates within this level, which could indicate an accumulation phase for the memecoin. Given that the broader price structure remains bullish, BONK could continue moving upward from here.
What does market sentiment indicate?
Currently, BONK’s market sentiment remains largely bullish.
Spot traders are leading the bullish momentum, purchasing $1.77 million worth of BONK and moving the tokens into private wallets for likely long-term holding, according to Coinglass’s Netflow data.
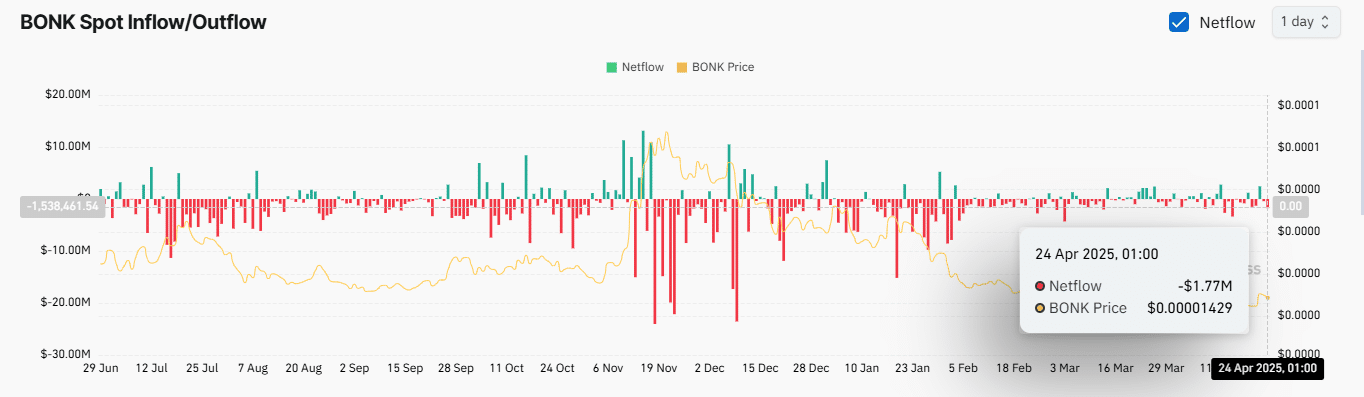
Source: Coinglass
This buying activity aligns with BONK trading into the market support level, suggesting that most traders are leaning bullish and driving the market in that direction.
On top of that, derivatives activity has intensified. Open Interest climbed to $22 million, a level last seen in December 2024.
Paired with stable Funding Rates, the data supports a bullish market structure, further validating upside potential.
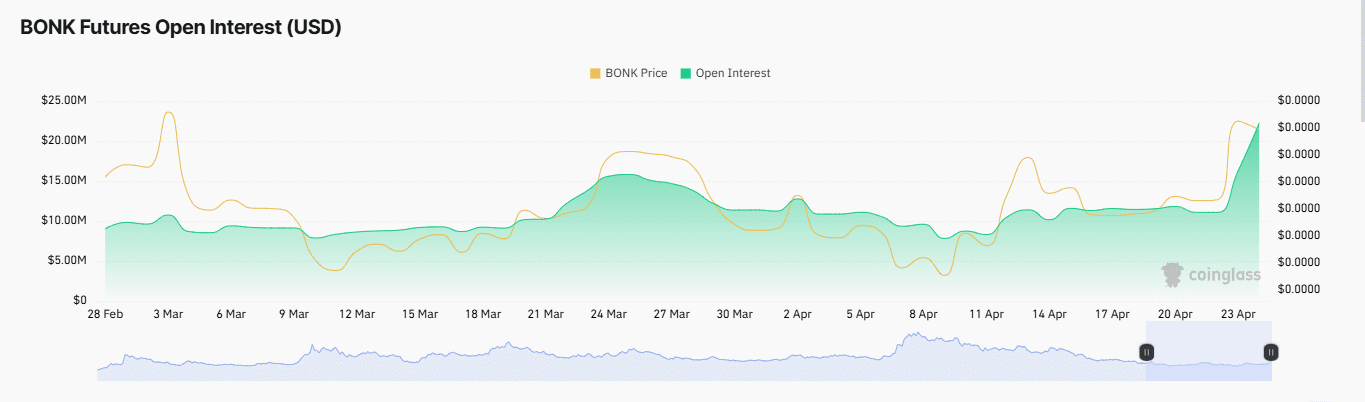
Source: CoinGlass
What caused BONK’s decline?
AMBCrypto’s analysis shows that BONK’s fall coincided with a drop in both the Relative Strength Index (RSI) and the Chaikin Money Flow (CMF).
The RSI is a momentum indicator that operates on a scale from 0 to 100 to evaluate market trends. At the time of analysis, RSI had dropped to 59.29.
This decline reflects the presence of bearish pressure. However, it is likely a temporary correction, as the RSI remained within the bullish zone between 50 and 70.
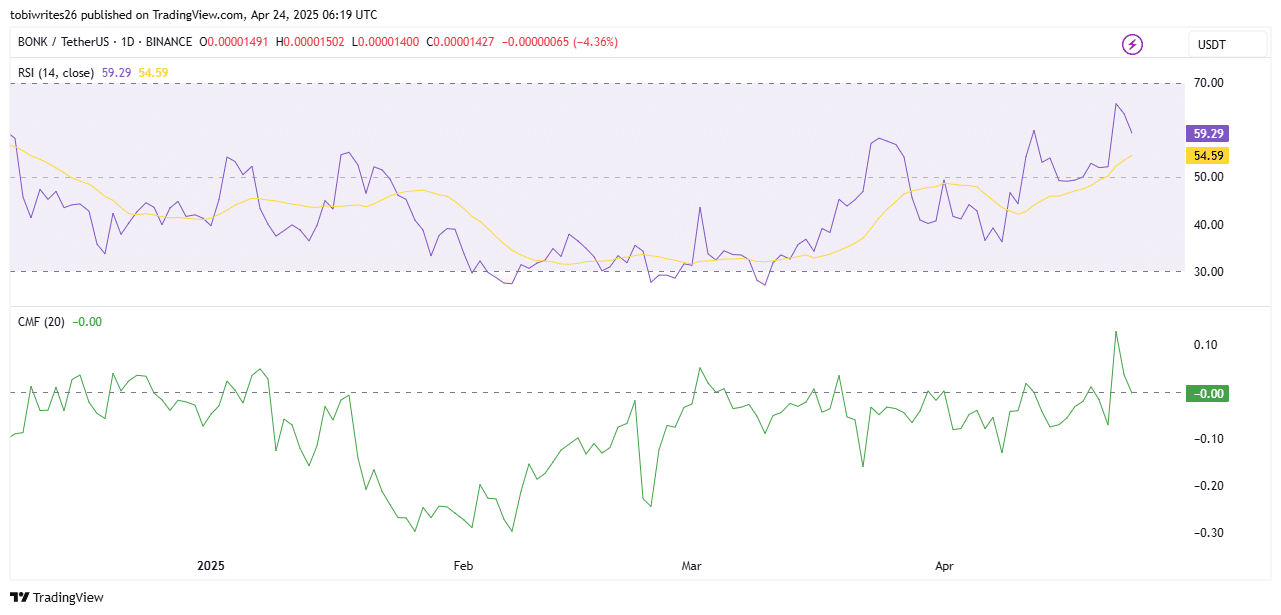
Source: TradingView
Additionally, the CMF, which measures buying and selling pressure over a period based on price and volume, at press time, the value stood at a neutral reading of 0.00.
This metric will be important to watch, as it may determine BONK’s next direction.
If CMF trends upward, it implies that buying activity has resumed, and BONK may continue to rise and supporting the earlier bullish outlook. If it trends downward instead, it could signal a bearish continuation.