
- PEPE has reached its Bollinger Band mid-range, which could trigger an upside breakout in the coming sessions.
- Diverging sentiment between spot and futures markets may limit PEPE’s chances of a strong rally.
Pepe [PEPE] appeared to be entering a corrective phase after surging 20% over the past month. In the past week alone, PEPE dropped 8.88%, weighed down by renewed selling pressure.
Market analysis shows this drop is part of a corrective phase, and the asset is likely to stage another move upward, adding to the existing bullish sentiment.
PEPE could rebound to the upside
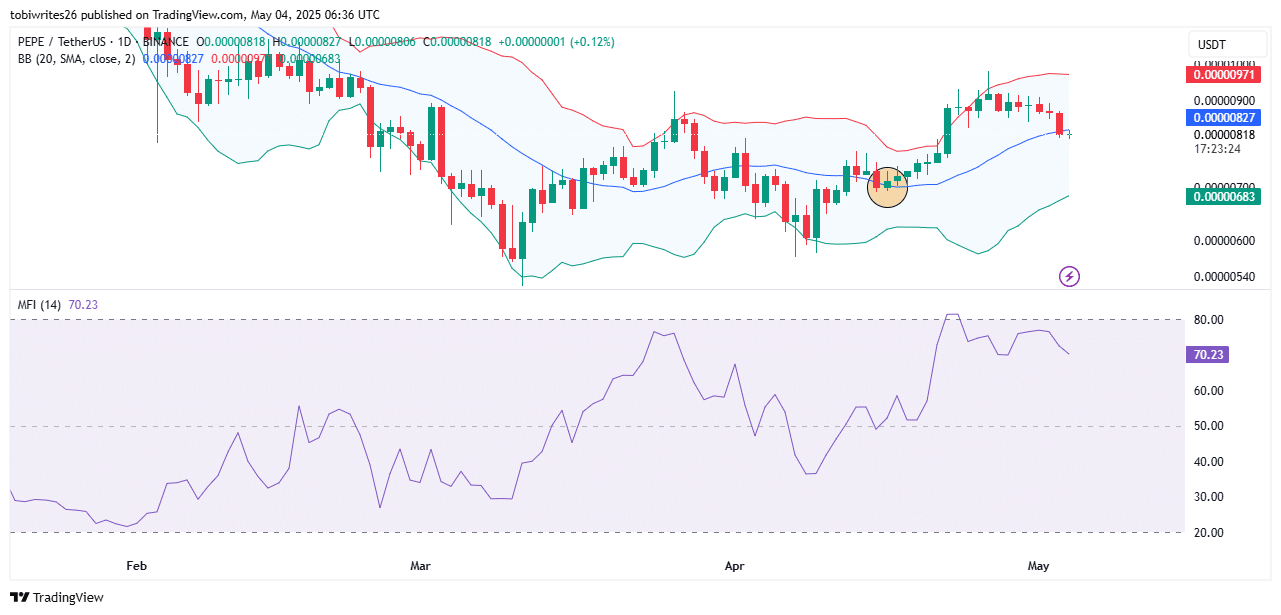
PEPE has traded into the mid-range of the Bollinger Band on the daily chart. This level can act either as a support that fuels a breakout or as a resistance that prevents further rallying.
To determine how PEPE is likely to react at this level, AMBCrypto reviewed its most recent behavior in the same zone.
The last time the memecoin traded in the mid-range of the Bollinger Bands (as marked by the orange circle), the asset rallied to the upside. This observation implies PEPE is likely to bounce from this level, potentially recovering its losses from the past week.
Source: TradingView
Interestingly, liquidity inflow into PEPE remains elevated, as indicated by the Money Flow Index (MFI). The MFI measures the inflow and outflow of liquidity into an asset.
When the index reads above 50, it reflects healthy liquidity inflows into the asset. At press time, the reading stood at 72.01, suggesting that PEPE’s uptrend could be ignited by this strong liquidity support.
A major resistance ahead
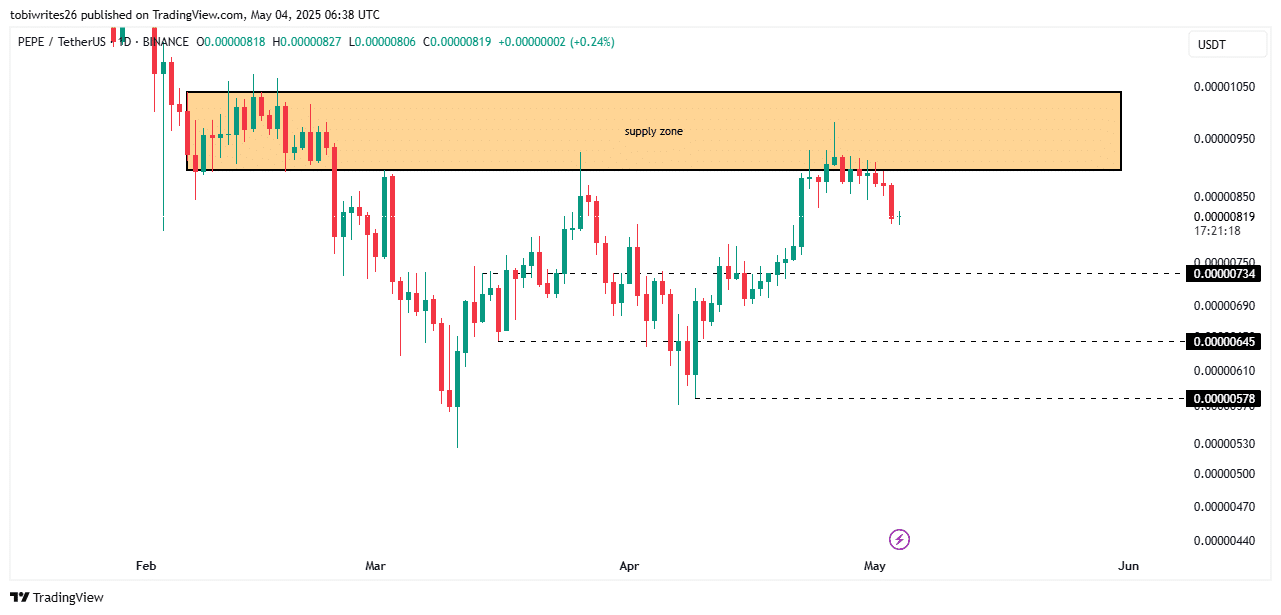
Further analysis shows that a price decline is possible if the memecoin rallies into overhead resistance.
If the asset continues its upward movement, it will likely enter a supply zone that could trigger a price cascade.
Source: TradingView
If market momentum stays strong, PEPE could breach this supply zone and extend its rally. However, if selling pressure builds before PEPE gains upside traction, the price is likely to drop further.
There are three key support levels to watch, i.e., $0.00000734, $0.00000645, and $0.00000578. At any of these levels, PEPE could attempt a rebound to the upside.
Mixed sentiment still remains
The market remains divided on the likely price direction for PEPE.
On one hand, traders in the futures market are leaning bullish, as shown by the rising Open Interest Weighted Funding Rate.
Over the past 24 hours, this metric rose to 0.0121%, a significantly high level associated with bullish market activity. The simple interpretation is that the majority of futures contracts currently open are long positions.
Source: CoinGlass
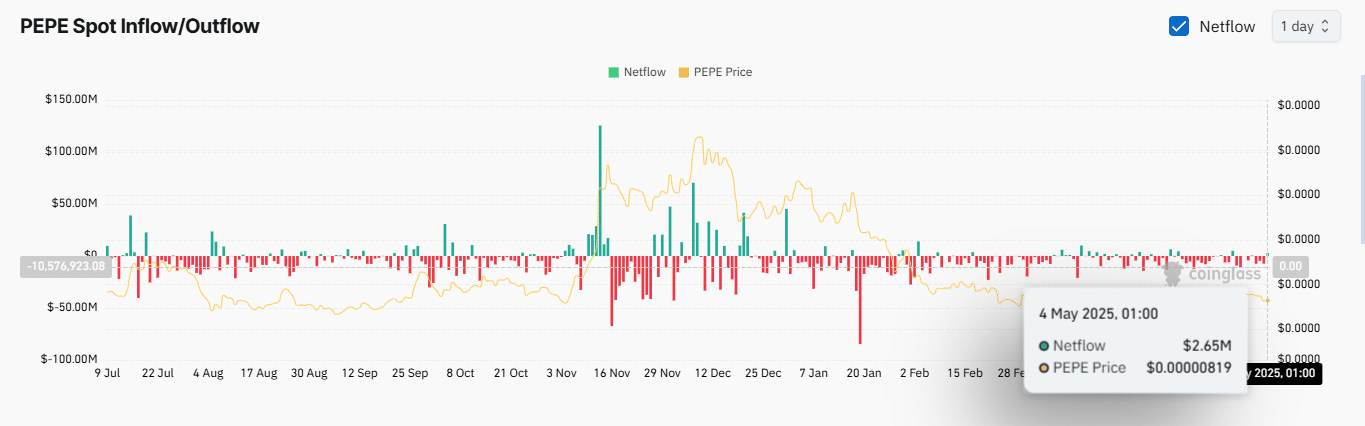
Surprisingly, spot traders have been selling.
On the flip side, spot traders weren’t as convinced. They offloaded $2.65 million worth of PEPE at the time of writing—a sharp pivot after several days of buying activity.
If this selling trend continues, PEPE could see a sharp drop to lower regions highlighted on the chart.
Ultimately, for the next major market movement to materialize, sentiment must shift decisively in one direction.