Close Menu
    What's Hot

    Ethereum Prepares For A Parabolic Move – ETH/BTC Chart Signals Strong Bullish Setup

    Ethereum Enters Strategic Pause: Will Accumulation Below Resistance Spark A Surge?

    Solana indicators point north, bulls test $165 target

    Facebook X (Twitter) Instagram
    yeek.io
    • Crypto Chart
    • Crypto Price Chart
    X (Twitter) Instagram TikTok
    Trending Topics:
    • Altcoin
    • Bitcoin
    • Blockchain
    • Crypto News
    • DeFi
    • Ethereum
    • Meme Coins
    • NFTs
    • Web 3
    yeek.io
    • Altcoin
    • Bitcoin
    • Blockchain
    • Crypto News
    • DeFi
    • Ethereum
    • Meme Coins
    • NFTs
    • Web 3
    Meme Coins

    PEPE rockets 55% in 4 days – Are whales luring investors into a trap?

    Yeek.ioBy Yeek.ioMay 10, 2025No Comments3 Mins Read
    Share Facebook Twitter Pinterest Copy Link Telegram LinkedIn Tumblr Email
    Share
    Facebook Twitter LinkedIn Pinterest Email
    • PEPE’s RSI hit 83 as buyer dominance grows, raising red flags for looming volatility and trend exhaustion.
    • Whales accumulated 21.18 trillion PEPE, mirroring historic buy zones that previously preceded sharp corrections.

    Amid the memecoin frenzy, Pepe [PEPE] recorded four days of consecutive gains. Since hitting a local low of $0.0000075, it has surged to a 4-month high of $0.0000139.

    At press time, it traded at $0.0000132—up 55.82% this week, despite slipping 2.05% in the past 24 hours. Naturally, this price action suggests strong demand, but there are signs the trend may not hold for long.

    This recent price upswing indicates strong demand, with buyers dominating the market.

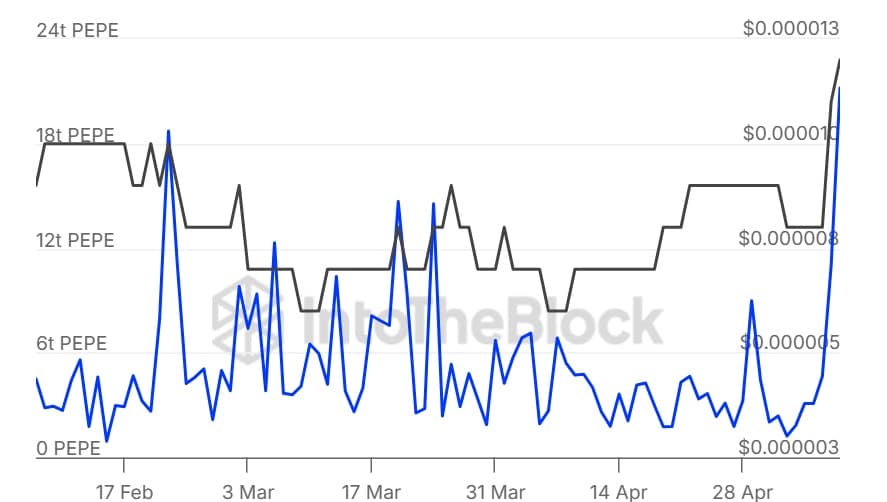
    This buying pressure is increasingly dominant among PEPE’s large holders. As such, whales have bought 21.18 trillion tokens in just 24 hours.

    Déjà vu or doom? The market has seen this movie before

    Such a massive buying pressure from PEPE whales was last witnessed in November 2024 and January 2025.

    Source: IntoTheBlock

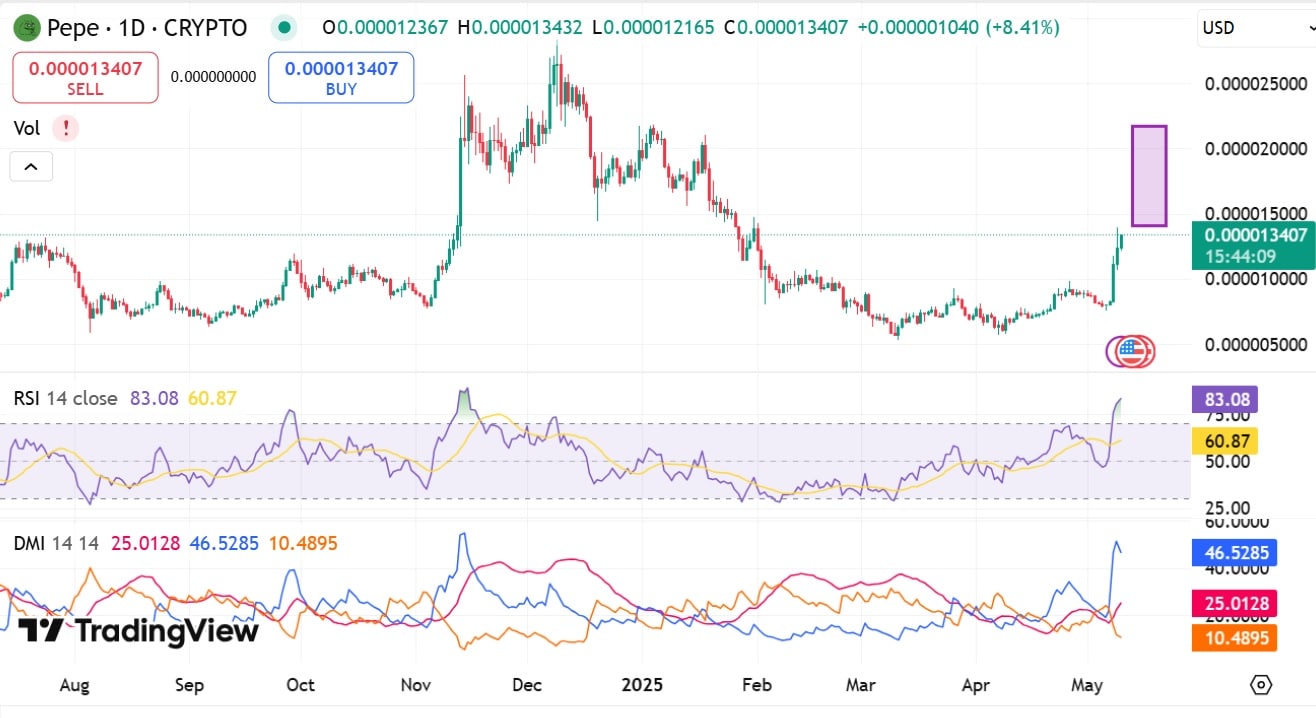
    This surge in buying has pushed the Relative Strength Index (RSI) to 83, deep into overbought territory. The last time RSI climbed above 80, PEPE hit record highs—only to crash shortly after.

    Historically, when buying activity surged to recently witnessed levels, it has preceded price correction as buyers get exhausted and sellers enter the market to take profit.

    For instance, in 2024, when RSI reached 88, Pepe surged to $0.00002525 in late November. When it reached 80, prices rallied to an all-time high in December.

    After this price uptick, it followed a massive decline, with the memecoin declining as low as $0.0000052.

    Source: TradingView

    So, if history rhymes, this wave of buying could be a prelude to another sharp correction.

    What do PEPE charts suggest?

    According to AMBCrypto’s analysis, with RSI reaching levels associated with correction, we have witnessed signs of a looming pullback over the past day.

    As stated earlier, the memecoin has dropped over the past day, abnormally in the trend over the past four days.

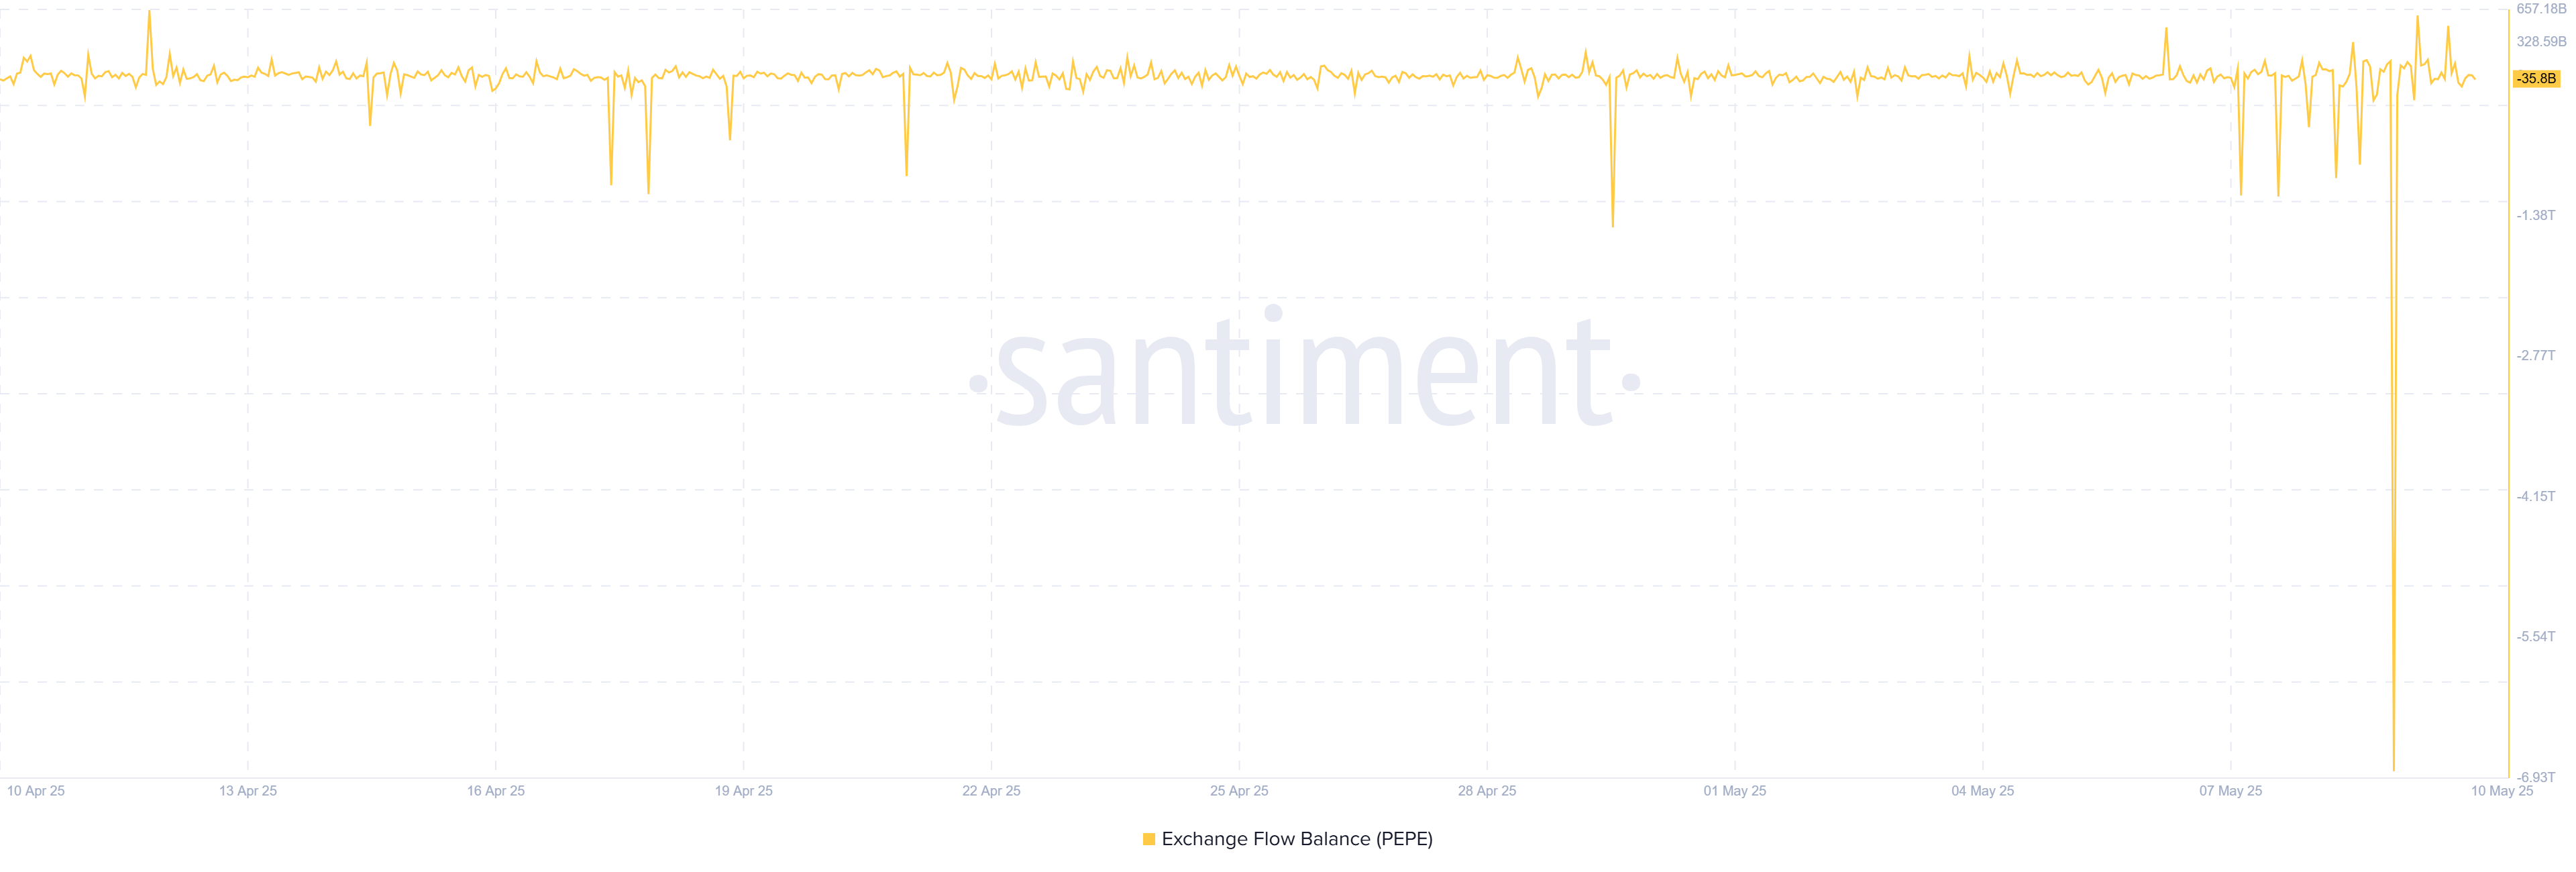
    However, the market isn’t folding just yet. PEPE’s Exchange Flow Balance sits at -35.8 billion, showing more withdrawals than deposits. That’s often a bullish sign, as it suggests traders are holding, not selling.

    Source: Santiment

    The continued accumulation suggests that investors are still bullish and see future potential with the memecoin.

    What’s next for the memecoin?

    PEPE is still in a strong downtrend at press time, as confirmed by rising DMI. Looking at the Directional Momentum, PEPE is experiencing strong upward momentum with +DI at 46 while -DI at 25.

    The momentum suggests a potential continuation of the current trend.

    If the trend continues, Pepe will cover the losses recorded on daily charts and attempt a move towards $0.000014. If it breaches this level, the next significant resistance is $0.000016.

    However, if the surge in RSI and buying spree leads to history repeating itself, Pepe will retrace to $0.0000107.


    Next: Is FLOKI’s rally built on solid demand or speculative hype? Assessing…

    Follow on Google News Follow on Flipboard
    Share. Facebook Twitter Pinterest LinkedIn Tumblr Email Copy Link
    Previous ArticleLatest Updates Unstaked’s 2700% ROI, Dogecoin & TRUMP Price Trends
    Next Article Mapping Dogecoin’s path: $0.24 resistance or pullback, what’s next?
    Avatar
    Yeek.io
    • Website

    Yeek.io is your trusted source for the latest cryptocurrency news, market updates, and blockchain insights. Stay informed with real-time updates, expert analysis, and comprehensive guides to navigate the dynamic world of crypto.

    Related Posts

    Dogecoin faces a sell wall – Will smart money hold or fold at $0.17?

    June 7, 2025

    Analyzing Dogecoin’s price recovery odds in the wake of Trump-Musk spat

    June 7, 2025

    Examining PENGU’s 9% pump – Will spot sell pressure ruin the bullish setup?

    June 7, 2025
    Leave A Reply Cancel Reply

    Advertisement
    Demo
    Latest Posts

    Ethereum Prepares For A Parabolic Move – ETH/BTC Chart Signals Strong Bullish Setup

    Ethereum Enters Strategic Pause: Will Accumulation Below Resistance Spark A Surge?

    Solana indicators point north, bulls test $165 target

    Cardano is at the Nexus of Bitcoin DeFi: Charles Hoskinson

    Popular Posts
    Advertisement
    Demo
    X (Twitter) TikTok Instagram

    Categories

    • Altcoin
    • Bitcoin
    • Blockchain
    • Crypto News

    Categories

    • Defi
    • Ethereum
    • Meme Coins
    • Nfts

    Quick Links

    • Home
    • About
    • Contact
    • Privacy Policy

    Important Links

    • Crypto Chart
    • Crypto Price Chart
    © 2025 Yeek. All Copyright Reserved

    Type above and press Enter to search. Press Esc to cancel.