
Ethereum is now trading above the $2,500 mark, reaching a fresh daily high of $2,609 as bullish momentum continues to build. After months of uncertainty and sideways action, sentiment has flipped strongly in favor of the bulls. The market-wide optimism is growing, fueled by Bitcoin’s breakout above $100K and renewed attention on altcoins, setting the stage for a potential altseason.
Ethereum’s sharp recovery from its lows has caught the attention of top analysts. Among them, Ted Pillows shared a technical breakdown highlighting that the ETH reversal has officially started. According to Pillows, the steep correction below $1,400 earlier this year marked the final phase of capitulation. He points to a textbook Wyckoff accumulation structure during that period, suggesting the groundwork was laid for a sustained bullish breakout.
This recent rally has not only broken through key resistance levels but has also confirmed a higher-high on the daily timeframe, which could serve as the catalyst for Ethereum’s next leg up. As the broader crypto market wakes up and capital rotation intensifies, ETH appears to be leading the charge, signaling that the long-awaited resurgence in altcoins may finally be underway.
Ethereum Reversal Signals The Start Of A New Cycle
Ethereum is finally showing real strength after months of bearish pressure. Since peaking in late December, ETH lost more than 66% of its value, dragging much of the altcoin market down with it. However, recent price action has flipped sentiment. Since early April, ETH has surged over 85%, pushing past several key resistance levels and reclaiming the $2,500 zone with momentum. This shift has sparked optimism among analysts and investors, with growing expectations of an altseason taking shape.
For many, Ethereum’s breakout represents more than just a short-term relief rally. It’s being seen as the confirmation of a trend reversal. According to Pillows, the steep drop below $1,400 marked the final capitulation phase in Ethereum’s correction cycle.

He notes that this phase aligned perfectly with Wyckoff accumulation principles — a classic structure that often precedes major uptrends. With the pattern now complete and ETH rallying sharply, Pillows argues that the reversal is underway.
His outlook is clear: ETH could reach $4,000 by Q3 if current momentum holds. He sees Ethereum’s resurgence not just as a recovery, but as the foundation for a broader altcoin rally. With ETH historically leading altseasons, its strength could soon spill over into other undervalued assets.
Ethereum Finds Resistance After Explosive Rally
Ethereum has staged a remarkable recovery, rallying from April lows around $1,370 to a new local high of $2,609 in just over a month—a gain of nearly 90%. The chart shows a powerful breakout that sliced through previous resistance zones and brought ETH firmly above the $2,500 mark. However, price has now paused right below the 200-day SMA at $2,701 and the 200-day EMA at $2,431, two historically important resistance zones.
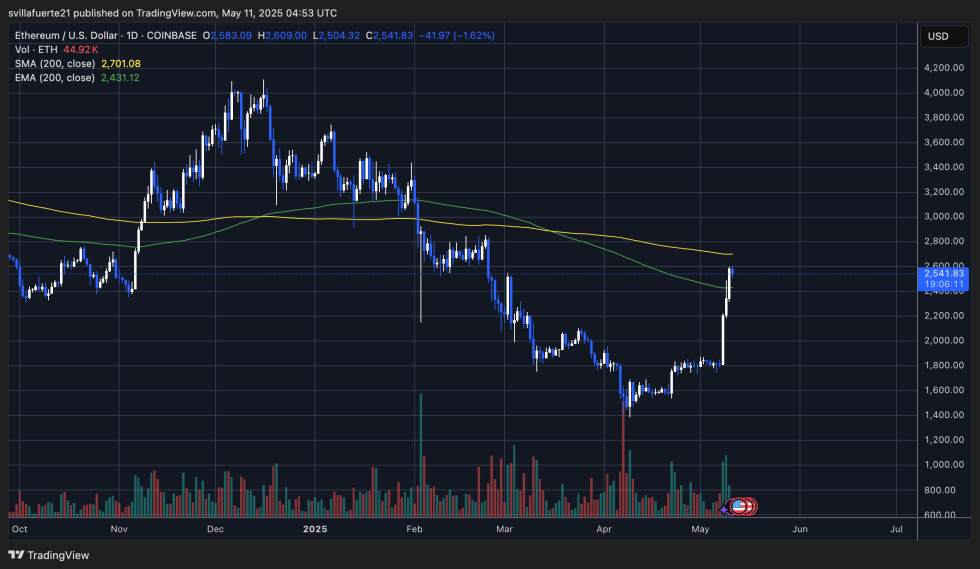
Volume has surged alongside the price, signaling strong participation and conviction from buyers. But after touching $2,609, ETH has started to show signs of consolidation as the daily candle prints a minor retrace. This could indicate temporary exhaustion as bulls digest the recent gains. A brief pullback or sideways movement around this zone would be a healthy development before any attempt to break the $2,700 resistance.
If Ethereum manages to reclaim the 200-day moving average cluster with strong volume, it could set the stage for a move toward $3,000. On the downside, holding above $2,400 will be key for maintaining the bullish momentum. With the macro sentiment improving and altcoins gaining strength, ETH remains a key asset to watch in the current cycle.
Featured image from Dall-E, chart from TradingView

Editorial Process for bitcoinist is centered on delivering thoroughly researched, accurate, and unbiased content. We uphold strict sourcing standards, and each page undergoes diligent review by our team of top technology experts and seasoned editors. This process ensures the integrity, relevance, and value of our content for our readers.