Close Menu
    What's Hot

    US Ethereum ETFs Record 4 Consecutive Weeks Of Positive Inflows — Details

    Here’s why Sonic erased $1.3 billion in value

    Whales lose SYRUP sweet tooth despite Maple Finance’s growth

    Facebook X (Twitter) Instagram
    yeek.io
    • Crypto Chart
    • Crypto Price Chart
    X (Twitter) Instagram TikTok
    Trending Topics:
    • Altcoin
    • Bitcoin
    • Blockchain
    • Crypto News
    • DeFi
    • Ethereum
    • Meme Coins
    • NFTs
    • Web 3
    yeek.io
    • Altcoin
    • Bitcoin
    • Blockchain
    • Crypto News
    • DeFi
    • Ethereum
    • Meme Coins
    • NFTs
    • Web 3
    Meme Coins

    PEPE’s price dip poses a risky buying opportunity – All you need to know

    Yeek.ioBy Yeek.ioMay 15, 2025No Comments3 Mins Read
    Share Facebook Twitter Pinterest Copy Link Telegram LinkedIn Tumblr Email
    Share
    Facebook Twitter LinkedIn Pinterest Email
    • Pepe settled into a range formation over the past four days.
    • The liquidation levels below the range low presented an attractive short-term price target.

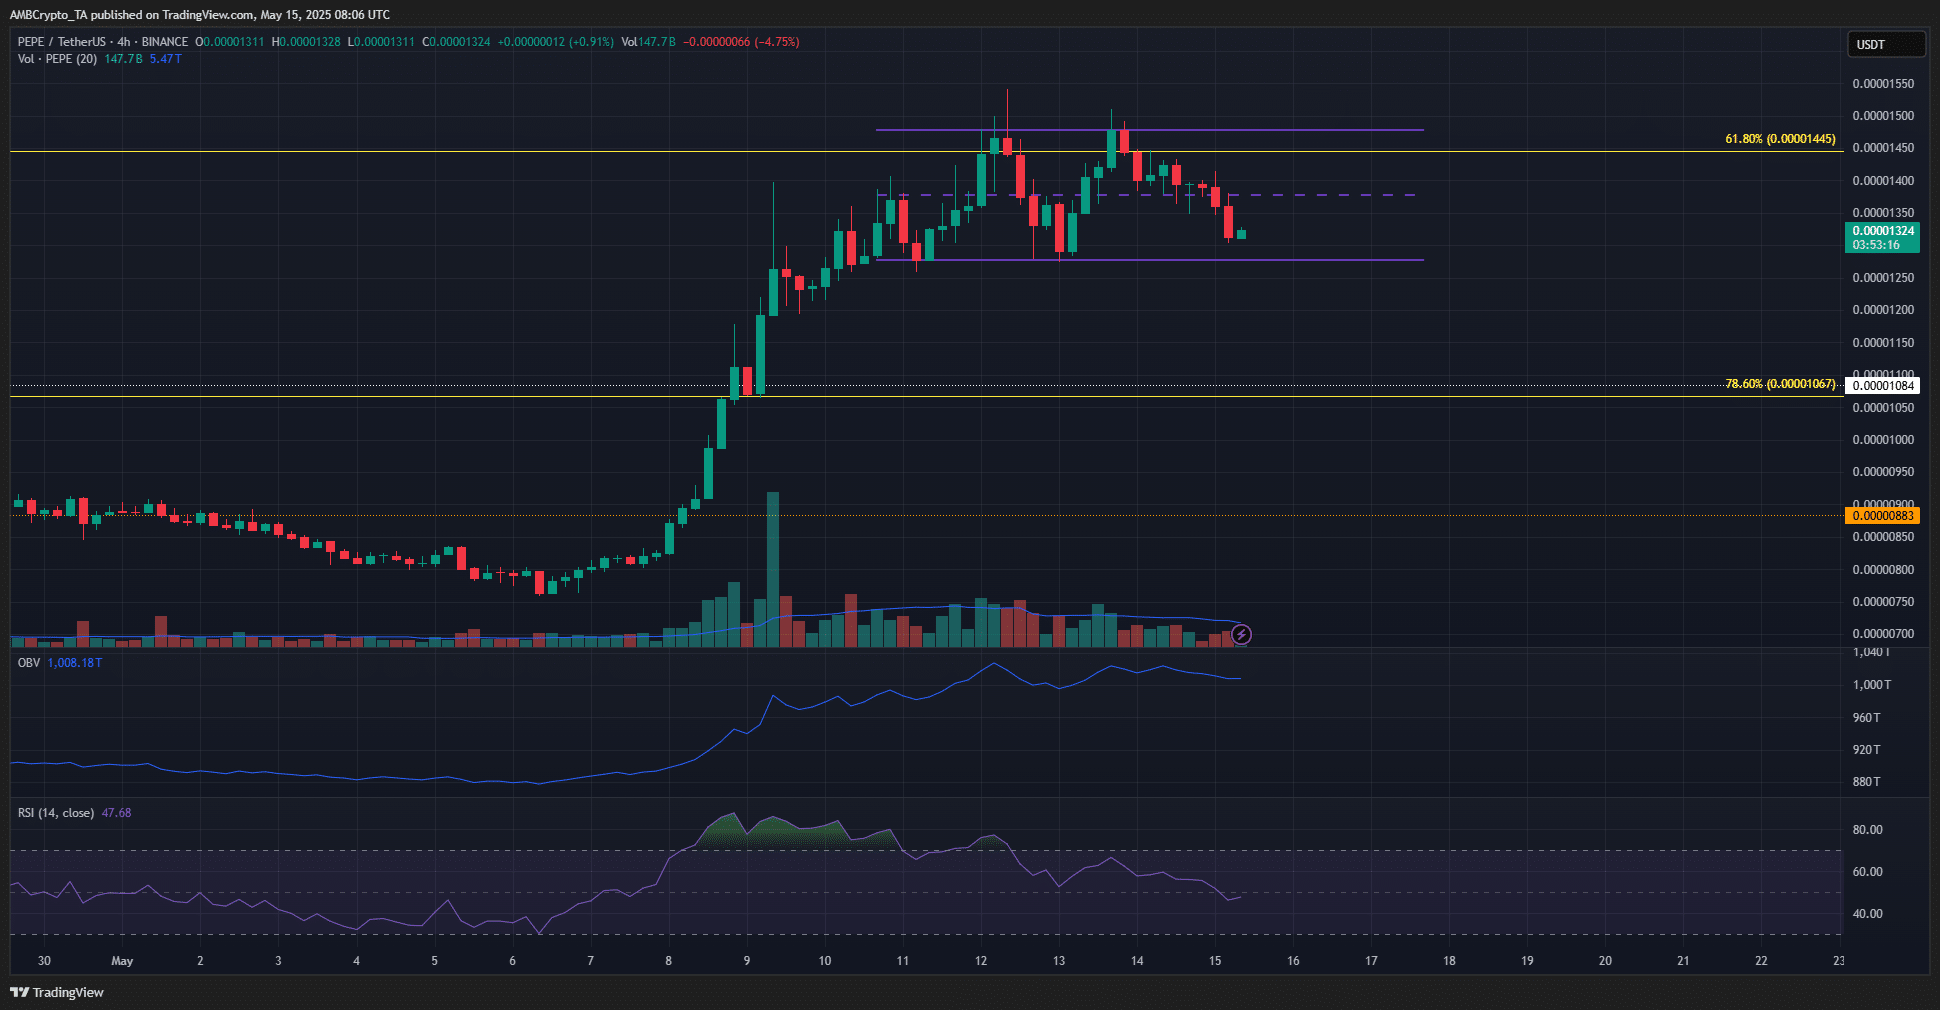
    In an earlier analysis, it was reported that Pepe [PEPE] faced risks of profit-taking. The 61.8% Fibonacci retracement level at $0.0000145 has temporarily rebuffed the bullish advance.

    The memecoin had made exemplary progress beyond long-term resistance levels in May, but its momentum had stalled over the past four days.

    During this period, the bullish momentum of Bitcoin [BTC] has also slowed down. The altcoin market had been trending higher for a month, but saw some short-term setbacks.

    As a result of the shift in sentiment, it was possible that PEPE would witness a price drop.

    How deep could this PEPE retracement go?

    Pepe 4-hour Chart

    Source: PEPE/USDT on TradingView

    The range formation, highlighted in purple, extended from $0.0000127 to $0.0000148. The mid-range level was at $0.0000138. PEPE had slipped below this support in recent hours.

    The RSI on the 4-hour chart also reflected a shift in momentum recently.

    It fell below the neutral 50 level, an early indication that sellers were taking the upper hand. However, the OBV remained static near the local highs. This was because of the low trading volume over the past three days.

    Hence, even though PEPE might witness a dip, the selling pressure was not overwhelming. The price dip was instead a product of the wider market sentiment, as well as a move towards liquidity.
    Pepe CoinalyzePepe Coinalyze

    Source: Coinalyze

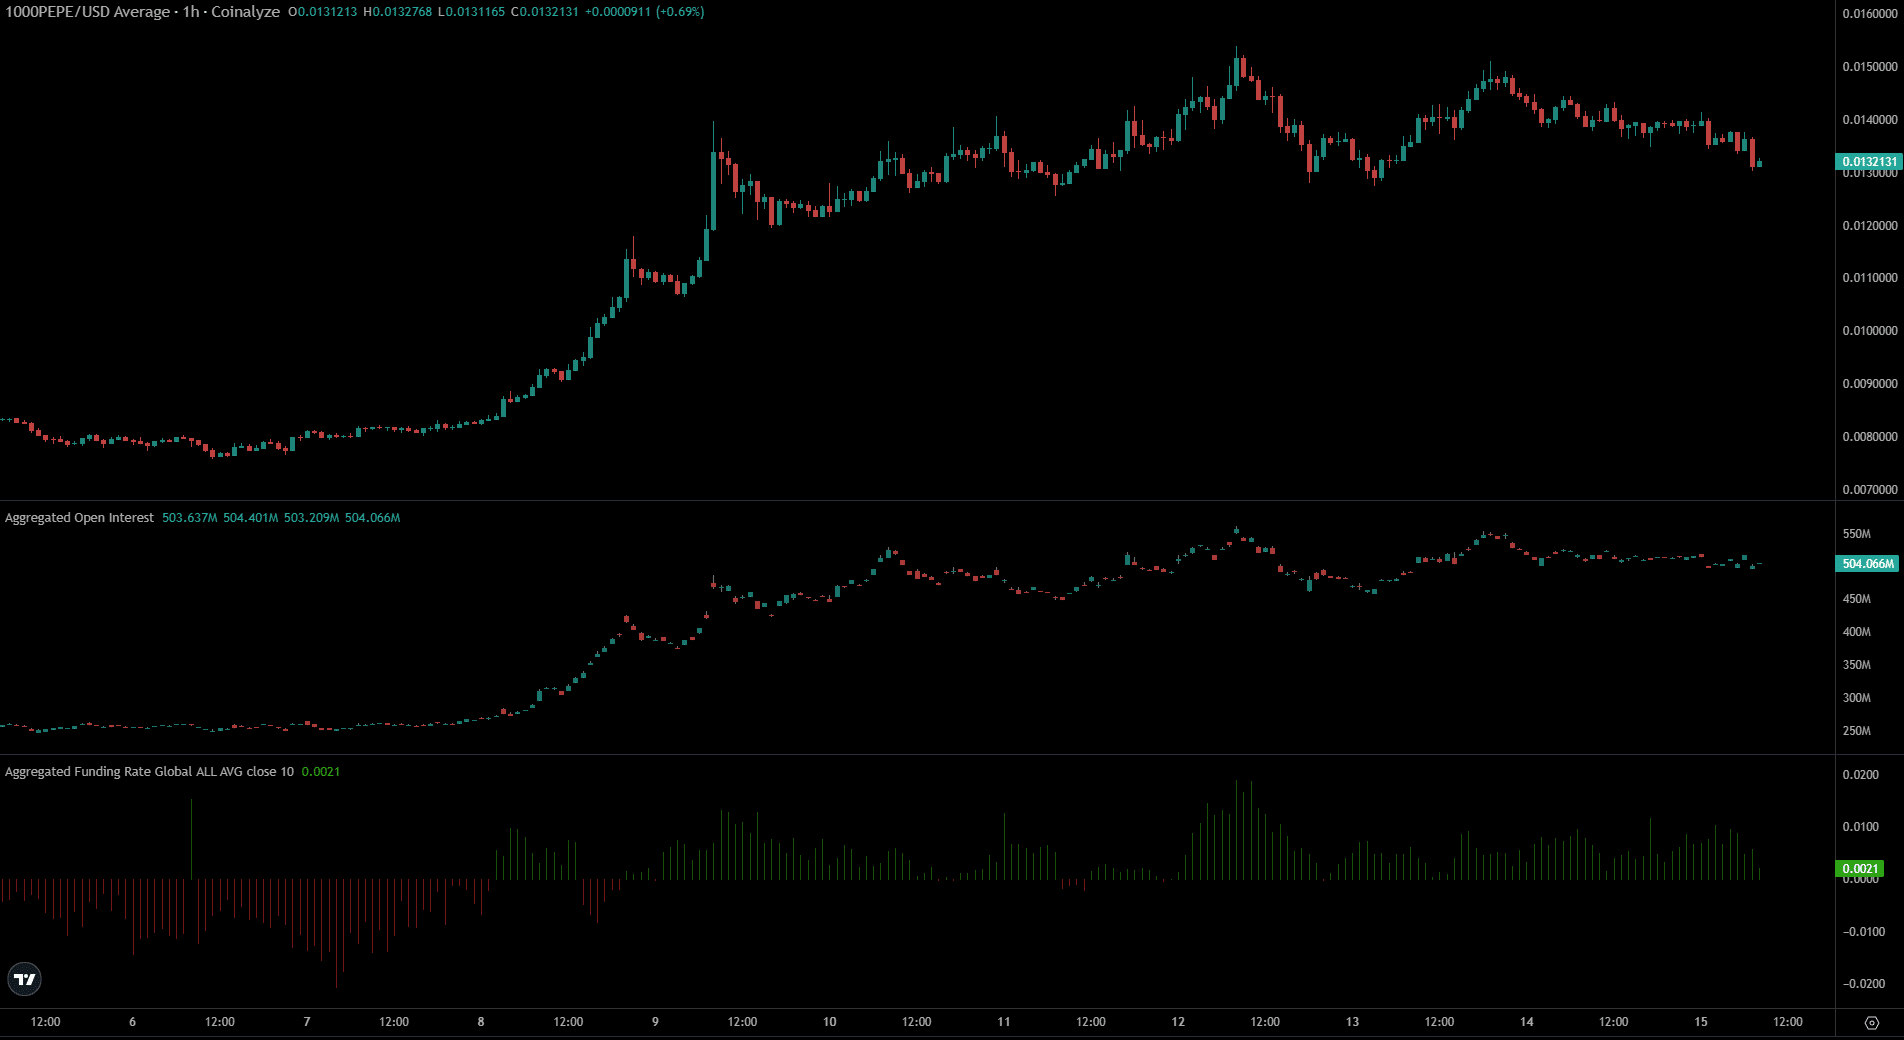
    The Open Interest, like the OBV, has been flat over the past four days. It reflected a lack of speculative interest in the memecoin.

    Yet, the Funding Rate remained positive. It appeared that Futures traders were unwilling to enter new positions, but short-selling was not popular either.
    Pepe Liquidation HeatmapPepe Liquidation Heatmap

    Source: CoinGlass

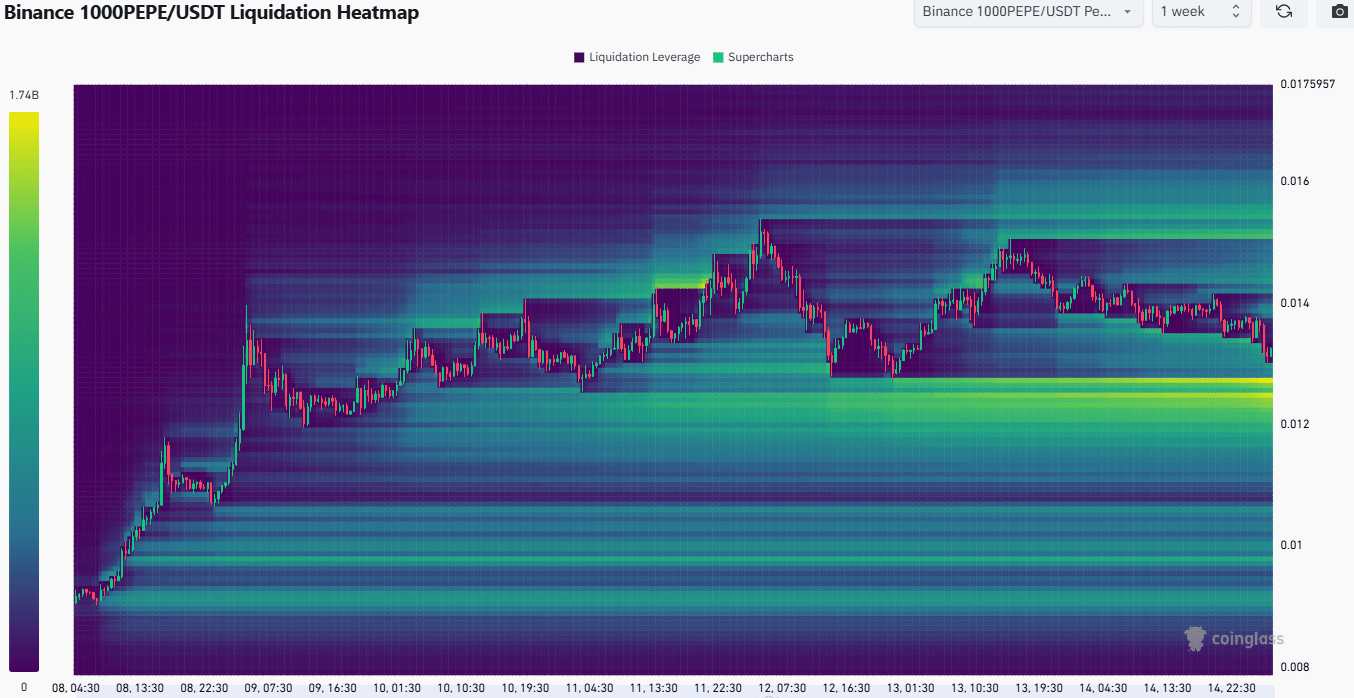
    The 1-week liquidation map also gave valuable clues. It underlined the $0.0000124-$0.0000127 area as a nearby liquidity pocket. These levels were just below the short-term range plotted earlier.

    Therefore, it was highly likely that PEPE would present a deviation below the range in the next few hours. Such a dip would likely be a buying opportunity.

    Traders taking long positions should manage their risk and position size wisely, knowing that a bullish reversal was not guaranteed.

    Disclaimer: The information presented does not constitute financial, investment, trading, or other types of advice and is solely the writer’s opinion

    Next: Is Bitcoin approaching a local top? – Traders, here’s what to expect

    Follow on Google News Follow on Flipboard
    Share. Facebook Twitter Pinterest LinkedIn Tumblr Email Copy Link
    Previous ArticleEthereum unveils new plan amid tokenization boom
    Next Article Will Crypto’s Wealth Distribution Ever Be Fair?
    Avatar
    Yeek.io
    • Website

    Yeek.io is your trusted source for the latest cryptocurrency news, market updates, and blockchain insights. Stay informed with real-time updates, expert analysis, and comprehensive guides to navigate the dynamic world of crypto.

    Related Posts

    Dogecoin faces a sell wall – Will smart money hold or fold at $0.17?

    June 7, 2025

    Analyzing Dogecoin’s price recovery odds in the wake of Trump-Musk spat

    June 7, 2025

    Examining PENGU’s 9% pump – Will spot sell pressure ruin the bullish setup?

    June 7, 2025
    Leave A Reply Cancel Reply

    Advertisement
    Demo
    Latest Posts

    US Ethereum ETFs Record 4 Consecutive Weeks Of Positive Inflows — Details

    Here’s why Sonic erased $1.3 billion in value

    Whales lose SYRUP sweet tooth despite Maple Finance’s growth

    Ethereum Prepares For A Parabolic Move – ETH/BTC Chart Signals Strong Bullish Setup

    Popular Posts
    Advertisement
    Demo
    X (Twitter) TikTok Instagram

    Categories

    • Altcoin
    • Bitcoin
    • Blockchain
    • Crypto News

    Categories

    • Defi
    • Ethereum
    • Meme Coins
    • Nfts

    Quick Links

    • Home
    • About
    • Contact
    • Privacy Policy

    Important Links

    • Crypto Chart
    • Crypto Price Chart
    © 2025 Yeek. All Copyright Reserved

    Type above and press Enter to search. Press Esc to cancel.