Close Menu
    What's Hot

    Ethereum Prepares For A Parabolic Move – ETH/BTC Chart Signals Strong Bullish Setup

    Ethereum Enters Strategic Pause: Will Accumulation Below Resistance Spark A Surge?

    Solana indicators point north, bulls test $165 target

    Facebook X (Twitter) Instagram
    yeek.io
    • Crypto Chart
    • Crypto Price Chart
    X (Twitter) Instagram TikTok
    Trending Topics:
    • Altcoin
    • Bitcoin
    • Blockchain
    • Crypto News
    • DeFi
    • Ethereum
    • Meme Coins
    • NFTs
    • Web 3
    yeek.io
    • Altcoin
    • Bitcoin
    • Blockchain
    • Crypto News
    • DeFi
    • Ethereum
    • Meme Coins
    • NFTs
    • Web 3
    Meme Coins

    Shiba Inu sees 8% surge in Open Interest – Is a price move coming?

    Yeek.ioBy Yeek.ioMay 29, 2025No Comments2 Mins Read
    Share Facebook Twitter Pinterest Copy Link Telegram LinkedIn Tumblr Email
    Share
    Facebook Twitter LinkedIn Pinterest Email
    • Shiba Inu flashed a sign of bullish intent in the speculative markets, but the sentiment quickly turned neutral.
    • The triangle pattern development threatened a bearish trend reversal.

    Shiba Inu [SHIB] broke out of a lower timeframe channel last week. This move sparked bullish hopes, but turned out to be a false alarm.

    The memecoin saw increased speculative activity less than 24 hours ago, but technical indicators showed that demand had slowed down.

    The descending triangle pattern and liquidation data showed that a price drop was imminent. The question was, how deep would the drop be?

    Shiba Inu bears threaten a 9% price drop

    Shiba Inu 1-day TradingView

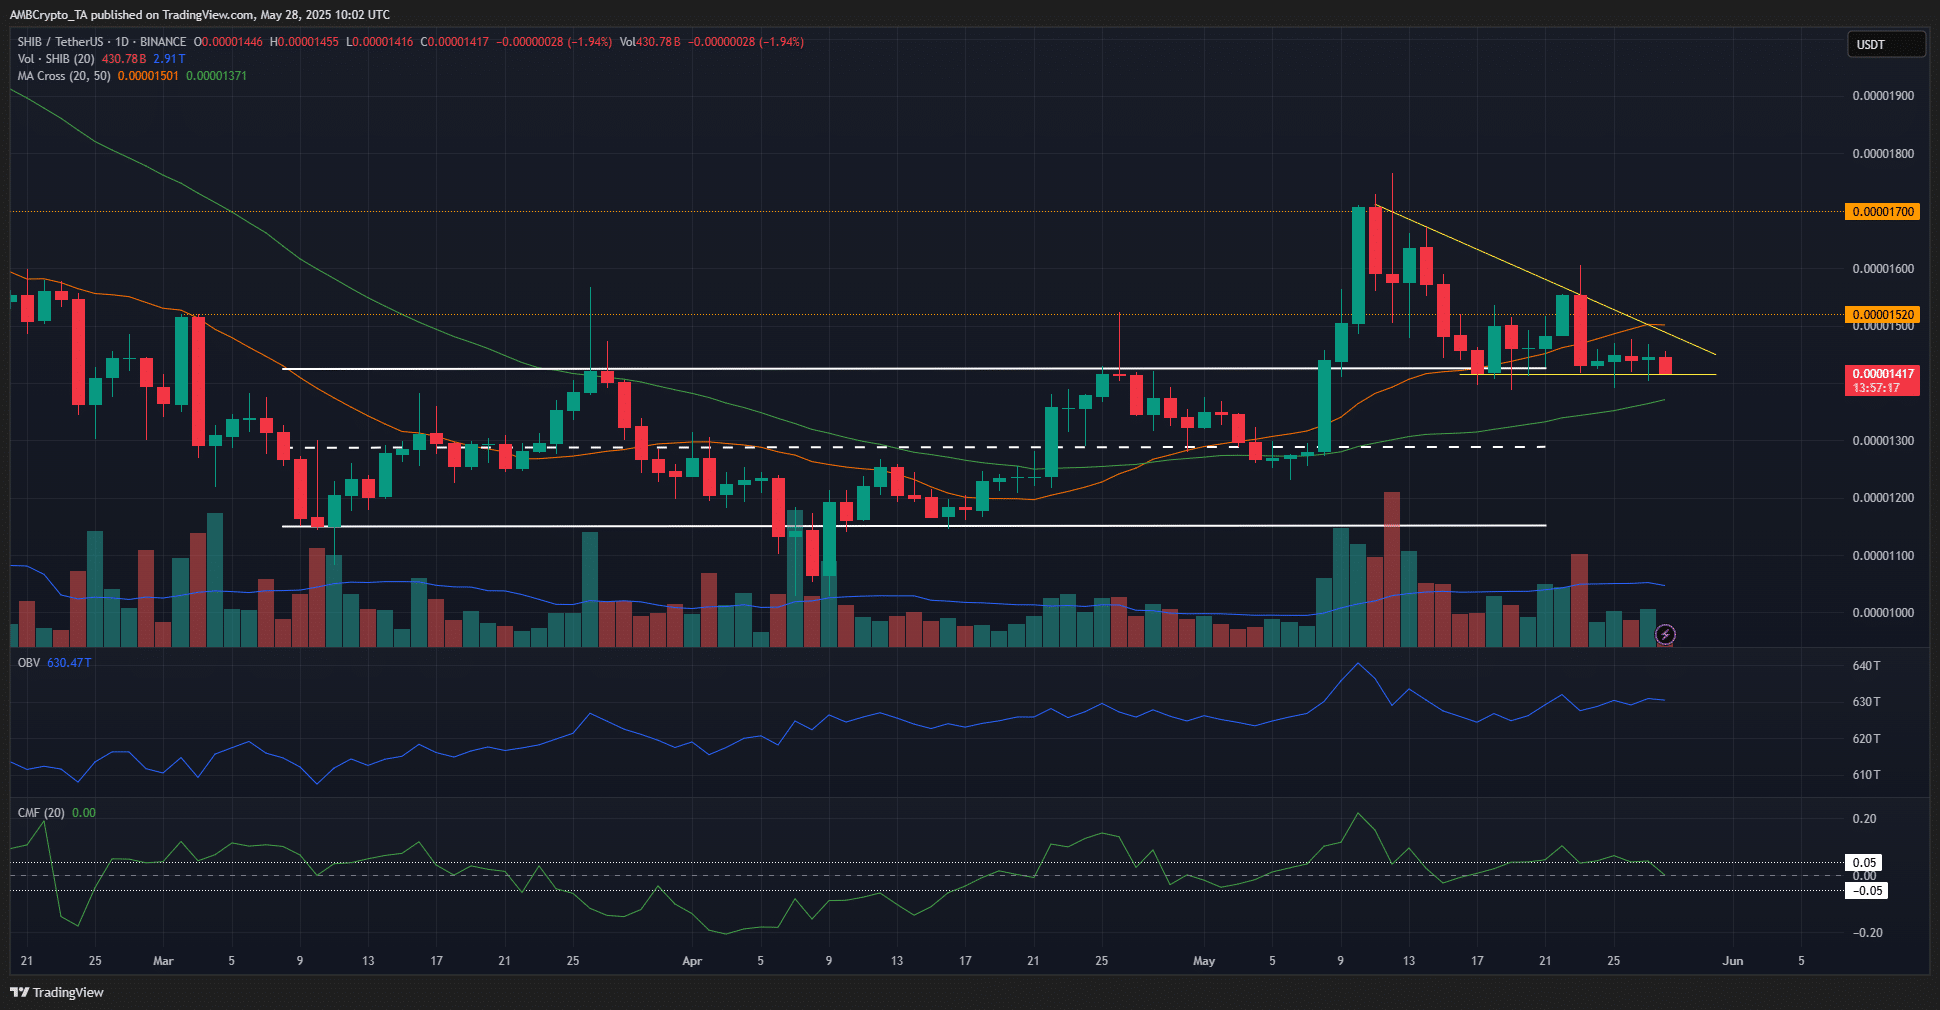
    Source: SHIB/USDT on TradingView

    The meme coin saw a bullish breakout in the second week of May, but the trend could not advance beyond $0.000017. This resistance level marked a lower high from mid-February.

    Over the past three weeks, Shiba Inu has sunk toward the former range highs at $0.000014.

    The 20 and 50-day moving averages showed that momentum was still bullish, but has weakened considerably. The SHIB market structure was on the verge of flipping bearishly.

    A session close below $0.0000142 would achieve this structure shift.

    The CMF has sunk to the zero level, indicating that capital flow did not favor either buyers or sellers. The OBV has been moving sideways in May.

    Shiba Inu’s lower highs in recent days formed a descending triangle pattern (yellow). The weakened momentum and falling demand suggested that this pattern could mark a bearish trend reversal.
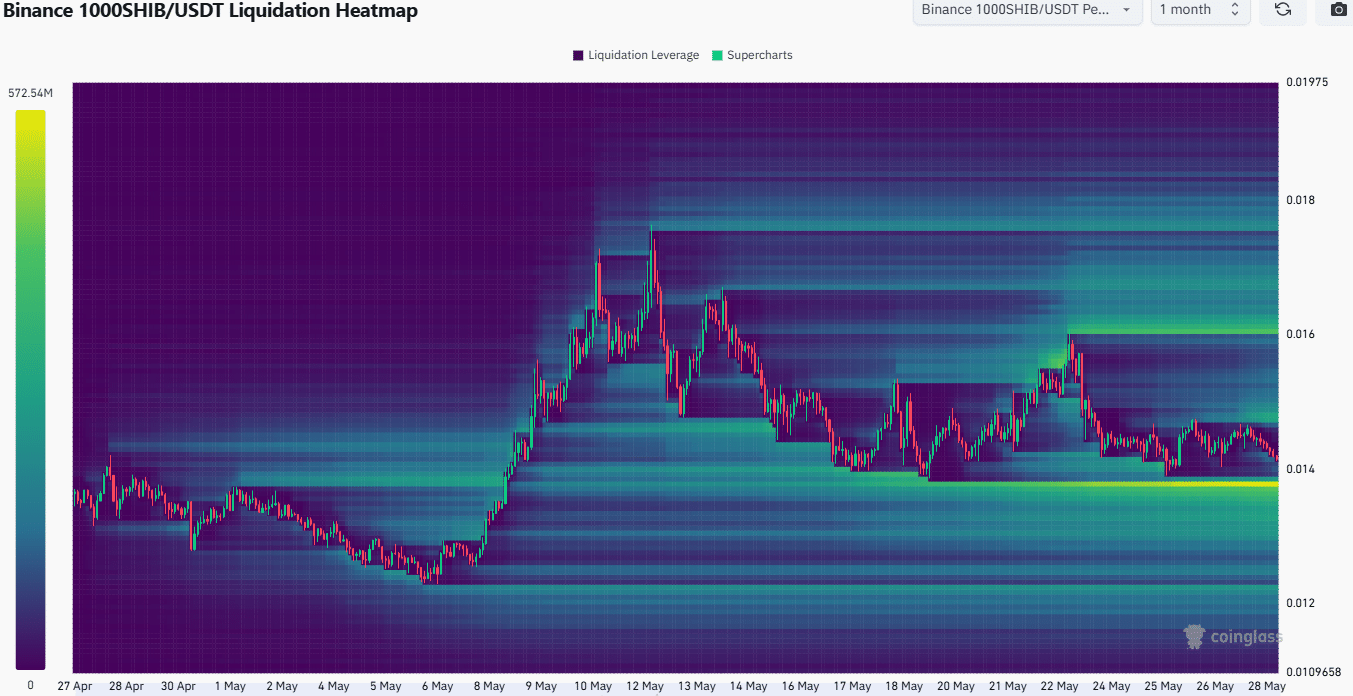
    SHIB Liquidation HeatmapSHIB Liquidation Heatmap

    Source: CoinGlass

    The liquidation heatmap agreed with this finding. The 1-month heatmap noted a cluster of liquidity just under $0.000014, the former range highs, and the current support level.

    This concentration of liquidation levels has built up over the past ten days.

    It was close to the Shiba Inu market price. Combined with the triangle pattern noted earlier, it was highly likely that SHIB would see a 3% drop soon.

    This could open the floodgates to the sellers and drive the memecoin toward the mid-range support at $0.0000129, a 9.3% drawdown from the current price.

    Disclaimer: The information presented does not constitute financial, investment, trading, or other types of advice and is solely the writer’s opinion

    Next: Ethereum Open Interest nears $20B as price soars – Is a bull run brewing?

    Follow on Google News Follow on Flipboard
    Share. Facebook Twitter Pinterest LinkedIn Tumblr Email Copy Link
    Previous ArticleCircle freezes 57M USDC linked to LIBRA memecoin scandal
    Next Article Ethereum reclaims $2.7K amid rising institutional interest
    Avatar
    Yeek.io
    • Website

    Yeek.io is your trusted source for the latest cryptocurrency news, market updates, and blockchain insights. Stay informed with real-time updates, expert analysis, and comprehensive guides to navigate the dynamic world of crypto.

    Related Posts

    Dogecoin faces a sell wall – Will smart money hold or fold at $0.17?

    June 7, 2025

    Analyzing Dogecoin’s price recovery odds in the wake of Trump-Musk spat

    June 7, 2025

    Examining PENGU’s 9% pump – Will spot sell pressure ruin the bullish setup?

    June 7, 2025
    Leave A Reply Cancel Reply

    Advertisement
    Demo
    Latest Posts

    Ethereum Prepares For A Parabolic Move – ETH/BTC Chart Signals Strong Bullish Setup

    Ethereum Enters Strategic Pause: Will Accumulation Below Resistance Spark A Surge?

    Solana indicators point north, bulls test $165 target

    Cardano is at the Nexus of Bitcoin DeFi: Charles Hoskinson

    Popular Posts
    Advertisement
    Demo
    X (Twitter) TikTok Instagram

    Categories

    • Altcoin
    • Bitcoin
    • Blockchain
    • Crypto News

    Categories

    • Defi
    • Ethereum
    • Meme Coins
    • Nfts

    Quick Links

    • Home
    • About
    • Contact
    • Privacy Policy

    Important Links

    • Crypto Chart
    • Crypto Price Chart
    © 2025 Yeek. All Copyright Reserved

    Type above and press Enter to search. Press Esc to cancel.