Close Menu
    What's Hot

    Ethereum Prepares For A Parabolic Move – ETH/BTC Chart Signals Strong Bullish Setup

    Ethereum Enters Strategic Pause: Will Accumulation Below Resistance Spark A Surge?

    Solana indicators point north, bulls test $165 target

    Facebook X (Twitter) Instagram
    yeek.io
    • Crypto Chart
    • Crypto Price Chart
    X (Twitter) Instagram TikTok
    Trending Topics:
    • Altcoin
    • Bitcoin
    • Blockchain
    • Crypto News
    • DeFi
    • Ethereum
    • Meme Coins
    • NFTs
    • Web 3
    yeek.io
    • Altcoin
    • Bitcoin
    • Blockchain
    • Crypto News
    • DeFi
    • Ethereum
    • Meme Coins
    • NFTs
    • Web 3
    Meme Coins

    TRUMP price prediction: Examining if bulls can hold the $12 support

    Yeek.ioBy Yeek.ioMay 29, 2025No Comments2 Mins Read
    Share Facebook Twitter Pinterest Copy Link Telegram LinkedIn Tumblr Email
    Share
    Facebook Twitter LinkedIn Pinterest Email
    • TRUMP has traded within a defined range for the past three weeks.
    • Persistent selling near the $15 mark reinforced bearish dominance and limited short-term upside momentum.

    Official Trump [TRUMP] saw a strong rally in April, climbing from $7.14 to $16.44, but it failed to sustain its momentum.

    The memecoin rallied in April on the news that the top 220 holders will get the chance to meet President Trump for dinner on the 22nd of May.

    Over the past three weeks, demand has weakened, and TRUMP was unable to rally beyond $14.4.

    Technical analysis highlighted key support and resistance levels for the memecoin. A price drop toward $10-$11 could offer a buying opportunity, but buying pressure needed to pick up to convince investors of a trend shift.

    Despite the weak demand, TRUMP could see a bullish reversal

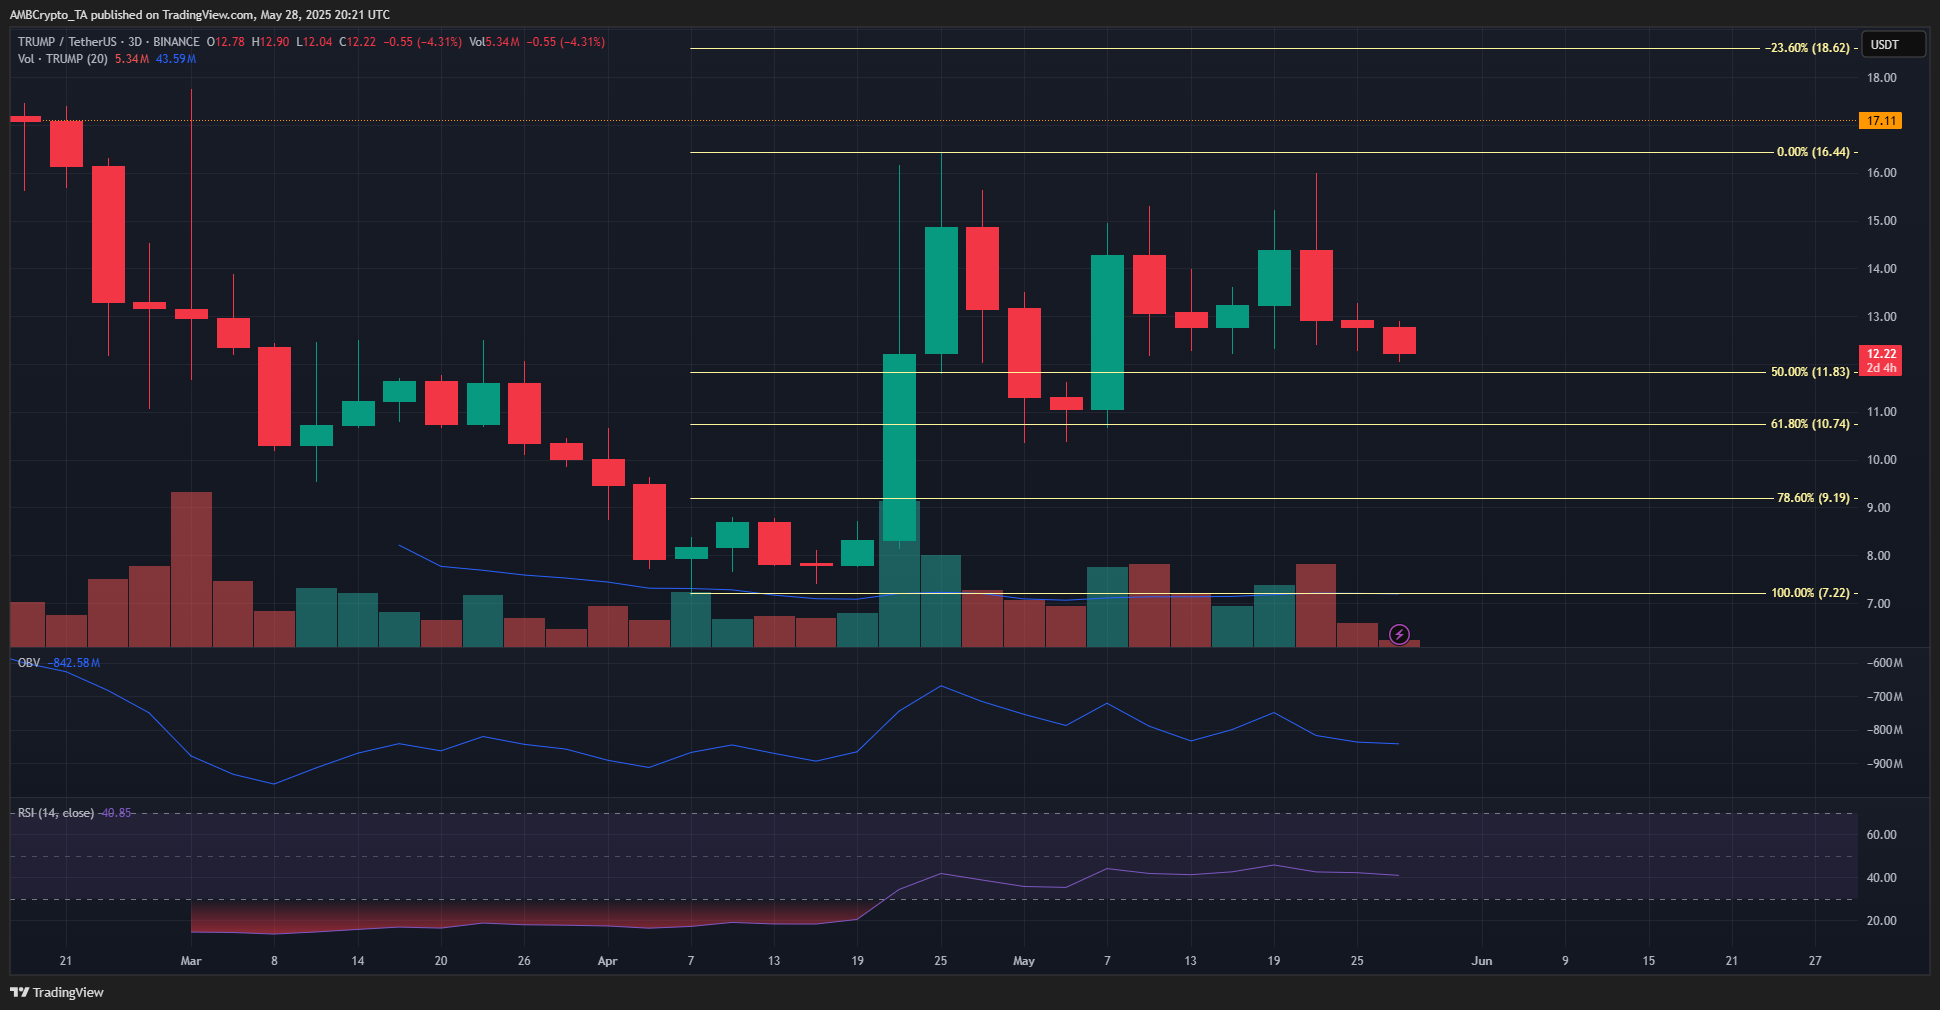
    TRUMP 1-day Chart

    Source: TRUMP/USDT on TradingView

    Following the April rally, Fibonacci retracement levels were plotted to analyze potential support.

    In early May, the 61.8% retracement level at $10.74 was tested as support and has held strong so far, keeping hopes alive for long-term holders anticipating a trend reversal.

    However, the steady decline in the OBV since late April was not a positive sign.

    Meanwhile, the RSI on the 3-day chart reflected that bearish momentum was dominant. This suggests that traders should brace for more losses.

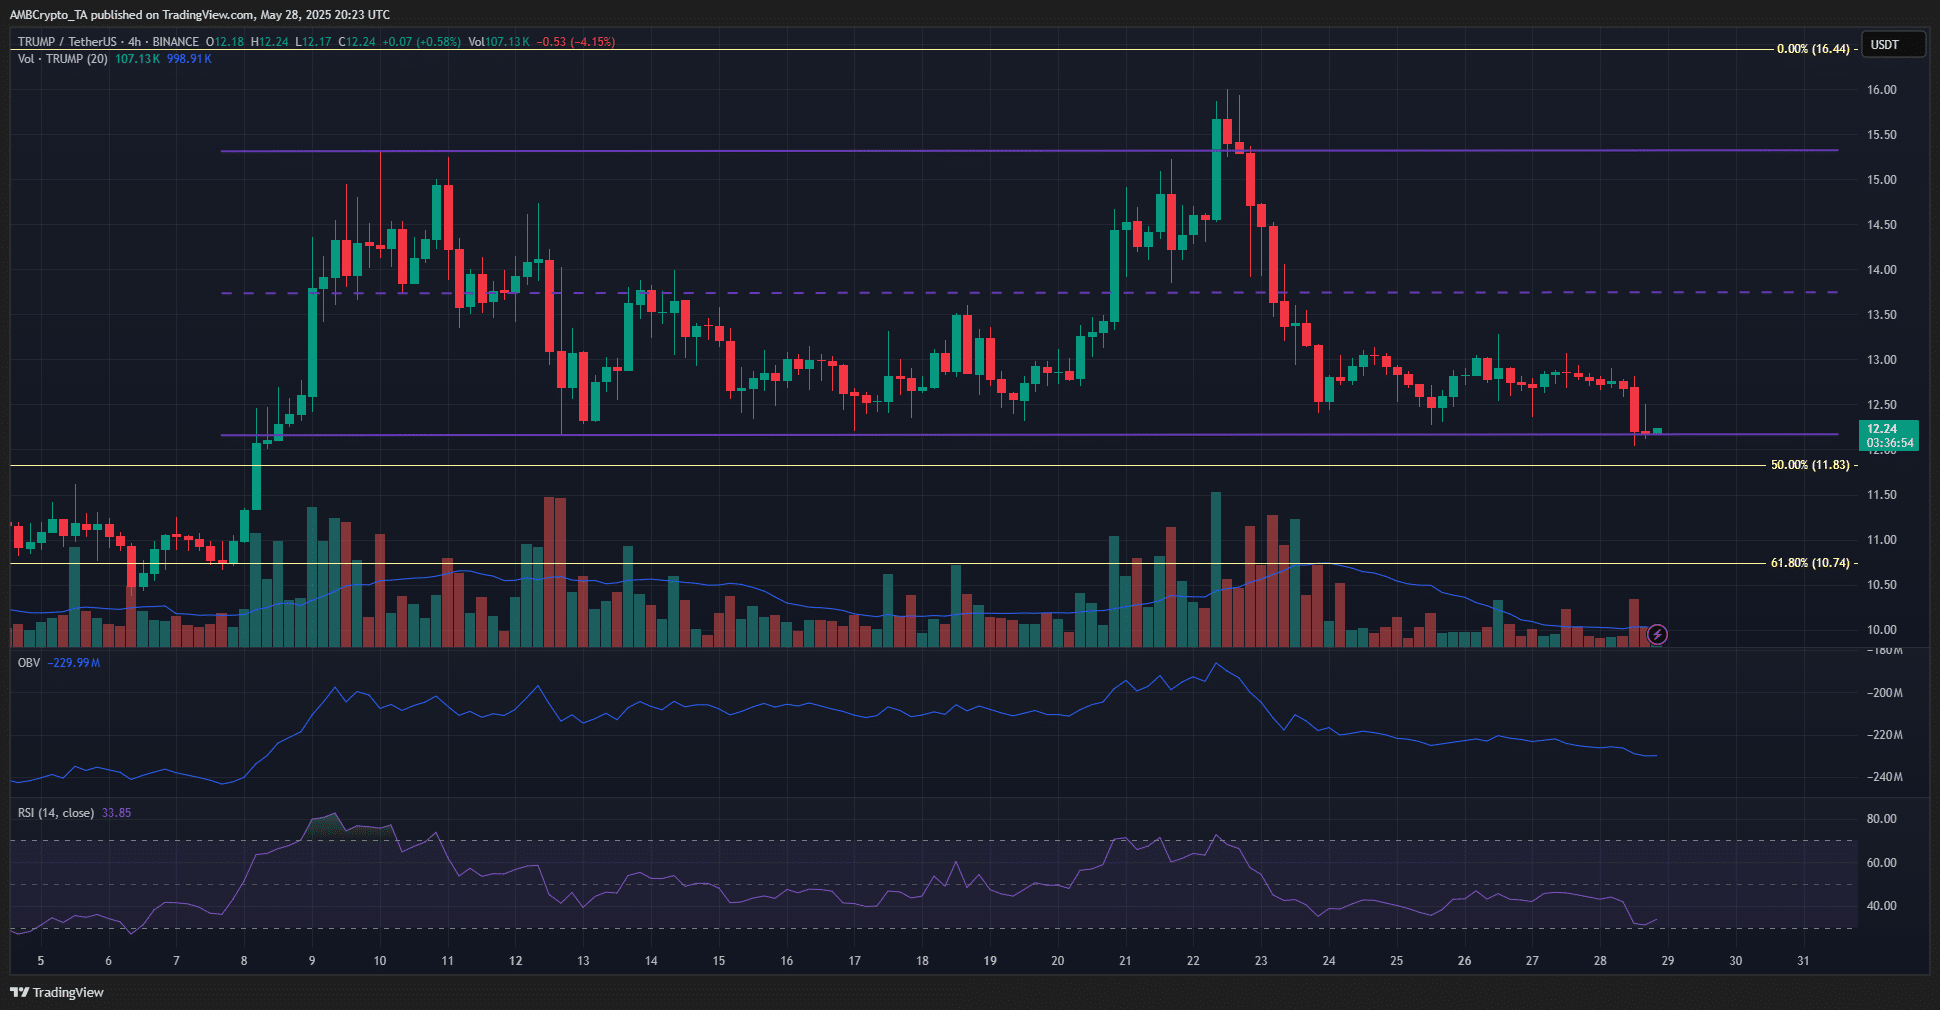
    TRUMP 4-hour ChartTRUMP 4-hour Chart

    Source: TRUMP/USDT on TradingView

    Interestingly, the 4-hour chart offered more hope.

    Its technical indicators were even more bearish, but TRUMP was trading at the three-week range low at $12.2. Therefore, even though demand was weak, it still offered a good risk-to-reward buying opportunity.

    Swing traders can set a stop-loss below $11.8, and use a rally to $13.75 (mid-range resistance) and $15.3 (range high) to take profits.
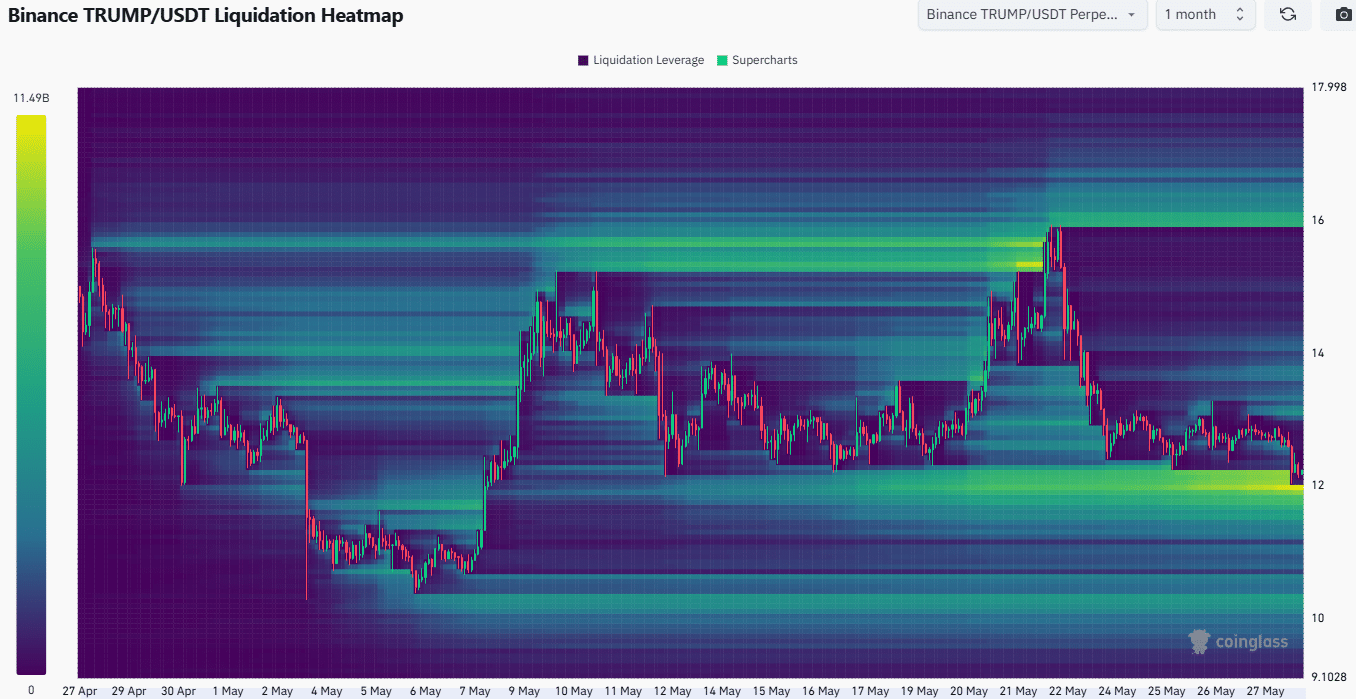
    TRUMP Liquidation HeatmapTRUMP Liquidation Heatmap

    Source: Coinglass

    The Liquidation Heatmap from CoinGlass revealed one more twist.

    It warned of another dip in the short term.

    The liquidity pocket around $12 was not fully swept, and a minor dip to $11.9 was possible. However, after collecting the liquidity at the range lows, a slow move toward the range highs could be the most likely scenario next.

    Disclaimer: The information presented does not constitute financial, investment, trading, or other types of advice and is solely the writer’s opinion

    Next: SUI hits $14.8B DEX record, yet price action is trailing – Why?

    Follow on Google News Follow on Flipboard
    Share. Facebook Twitter Pinterest LinkedIn Tumblr Email Copy Link
    Previous ArticleSEC delays Grayscale’s Avalanche and Cardano ETF decisions to July
    Next Article UNI eyes $10 as UniswapX launch triggers inverse H&S breakout
    Avatar
    Yeek.io
    • Website

    Yeek.io is your trusted source for the latest cryptocurrency news, market updates, and blockchain insights. Stay informed with real-time updates, expert analysis, and comprehensive guides to navigate the dynamic world of crypto.

    Related Posts

    Dogecoin faces a sell wall – Will smart money hold or fold at $0.17?

    June 7, 2025

    Analyzing Dogecoin’s price recovery odds in the wake of Trump-Musk spat

    June 7, 2025

    Examining PENGU’s 9% pump – Will spot sell pressure ruin the bullish setup?

    June 7, 2025
    Leave A Reply Cancel Reply

    Advertisement
    Demo
    Latest Posts

    Ethereum Prepares For A Parabolic Move – ETH/BTC Chart Signals Strong Bullish Setup

    Ethereum Enters Strategic Pause: Will Accumulation Below Resistance Spark A Surge?

    Solana indicators point north, bulls test $165 target

    Cardano is at the Nexus of Bitcoin DeFi: Charles Hoskinson

    Popular Posts
    Advertisement
    Demo
    X (Twitter) TikTok Instagram

    Categories

    • Altcoin
    • Bitcoin
    • Blockchain
    • Crypto News

    Categories

    • Defi
    • Ethereum
    • Meme Coins
    • Nfts

    Quick Links

    • Home
    • About
    • Contact
    • Privacy Policy

    Important Links

    • Crypto Chart
    • Crypto Price Chart
    © 2025 Yeek. All Copyright Reserved

    Type above and press Enter to search. Press Esc to cancel.