
UNI is flashing early signs of a bullish reversal, with a potential inverse head and shoulders breakout forming on the daily chart.
According to data from crypto.news, Uniswap (UNI) surged over 20% in the last 24 hours, reaching an intraday high of $7.6 on May 29, nearly 57% higher than its April low, while its market cap rose to around $4.4 billion.
Meanwhile, its daily trading volume increased by more than 200% to surpass $1 billion. The surge was echoed in the derivatives market, where open interest climbed 20% to a record $514 million, signalling a spike in leveraged long positions. Positive funding rates typically mean the majority of traders are positioned for further gains.
Technicals suggest more upside
From a technical standpoint, UNI appears poised for more sustained gains, having broken out of multiple bullish patterns on the daily chart.
UNI broke out of an inverse head and shoulders pattern and confirmed the move with a bullish engulfing candle on Thursday. Adding to the bullish case, the 20-day and 50-day moving averages just formed a golden cross, typically seen as a buy signal.
UNI price has also broken above a multi-month downtrend of lower highs and lower lows, clearing a key resistance zone. The SuperTrend indicator has also flipped bullish and is currently positioned below the price, providing another signal indicating further upside.
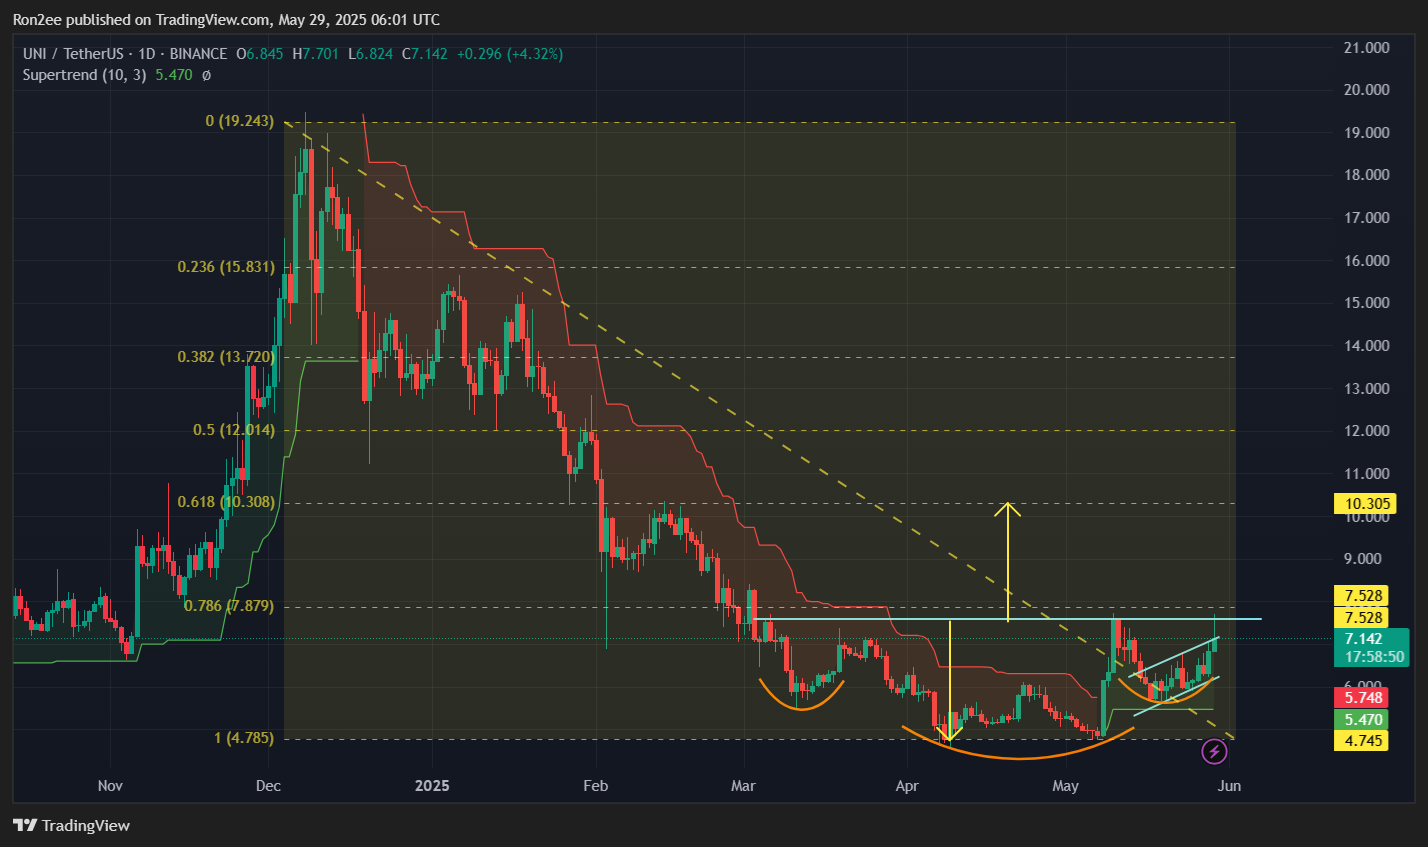
If this breakout holds, the inverse head and shoulders pattern suggests a potential move up to around $10, about 37% higher than current levels. That target also lines up with the 61.8% Fibonacci retracement level, giving it extra significance.
A major bullish driver that could be fueling UNI’s recent rally is UniswapX, a new feature designed to optimize each swap by routing it through the best available source.
It works by letting multiple fillers compete to offer users the most favorable price, tapping into both on-chain and off-chain liquidity. By removing the need for batching and adding competitive pricing, UniswapX has sparked strong interest across the DeFi space.
Adding to the momentum, large investors, also known as whales, have begun accumulating UNI in substantial amounts. According to data from Santiment, the number of addresses holding between 10,000 and 1 million UNI has jumped in recent days. This kind of accumulation usually signals growing confidence among large investors, which can often push prices higher.
Short-term pullback still on the table
Despite the bullish drivers and strong technical setup, there is still a key resistance level to watch around $7.87, which marks the 78.6% Fibonacci retracement and could act as a short-term hurdle, potentially leading to some consolidation or a minor pullback before the next leg up.
On the downside, if UNI drops below $6.5, it could invalidate the current bullish breakout pattern. In that case, the price might retrace further toward $5.81, which coincides with the 50-day simple moving average and could serve as a key support level for buyers to step back in.
Disclosure: This article does not represent investment advice. The content and materials featured on this page are for educational purposes only.