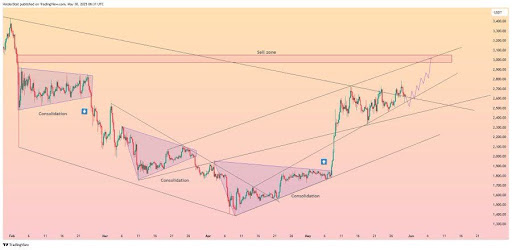
Ethereum (ETH) is gaining traction as it climbs within a well-structured ascending channel, following three distinct consolidation phases. These pauses in momentum have served as healthy resets, allowing bulls to regain strength and build a solid base.
With price action now trending upward in a controlled manner, ETH appears poised for a sustained rally, provided it maintains support along the channel’s lower boundary and breaks above near-term resistance.
Key Channel Unfolds As Ethereum Maintains Its Trajectory
HolderStat’s post on X reveals a compelling setup on the Ethereum chart, where the price action is inching closer to a significant resistance zone around $3,100, a level typically associated with profit-taking and potential reversal pressure. This area has been marked as a sell zone, and its alignment with the upper boundary of a technical resistance band makes it a critical battleground for bulls and bears alike.
However, the broader structure of the chart leans bullish. Ethereum is printing successive higher lows, a signal of upward momentum and strong buying interest on dips. The presence of breakout arrows is a visual cue used in HolderStat’s analyses to highlight key inflection points and further strengthen the narrative of an upcoming test of this ceiling.

On the 2-hour chart, Ethereum’s price action is currently coiling within a well-defined ascending triangle pattern, a formation that signals a bullish continuation. According to Logan Issac Borowu, ETH is holding firmly above the lower boundary, suggesting that buyers are actively defending the trendline and maintaining pressure on the resistance overhead.
The key level in focus now is $2,720, which marks the horizontal ceiling of the triangle. This level has rejected multiple breakout attempts, acting as a lid on Ethereum’s short-term upside. As the price continues to form higher lows against this resistance, bullish momentum is building.
A move above $2,720 could confirm the breakout and open the door for a move toward higher levels. The next technical target, based on the height of the triangle, is the $3,200 level, which aligns with the previous supply zone and resistance.
RSI Dips Toward Oversold—Bounce Incoming Or Bear Trap?
Ethereum’s upward path is not without barriers. Gemxbt has revealed a critical pattern forming on Ethereum’s 1-hour chart, particularly a Descending Triangle formation. ETH is currently compressing between horizontal support near $2,550 and descending resistance around $2,700, creating a tightening range.
Despite the possibility of a bounce as the RSI (Relative Strength Index) approaches oversold territory, the short-term momentum remains tilted to the downside. Ethereum is also trading below key moving averages, reinforcing the underlying weakness in trend structure.
Unless bulls reclaim the resistance level with conviction, the triangle pattern suggests a potential short-term breakdown, which could push ETH down to lower support zones. Conversely, a bounce from oversold levels could see the altcoin retest the $2,700 zone, which may lead to a shift in market sentiment.
Featured image from Getty Images, chart from Tradingview.com

Editorial Process for bitcoinist is centered on delivering thoroughly researched, accurate, and unbiased content. We uphold strict sourcing standards, and each page undergoes diligent review by our team of top technology experts and seasoned editors. This process ensures the integrity, relevance, and value of our content for our readers.

