
- The higher timeframe price action of WIF was bullish.
- Seller dominance over the past three weeks cast doubts on the memecoin’s bullish conviction.
dogwifhat [WIF] appeared to present a buying opportunity. Despite the selling pressure and lack of momentum in the past three weeks, the weekly chart inspired confidence.
Investors should remain patient, and a breakout past $1 and $1.2 could still materialize.
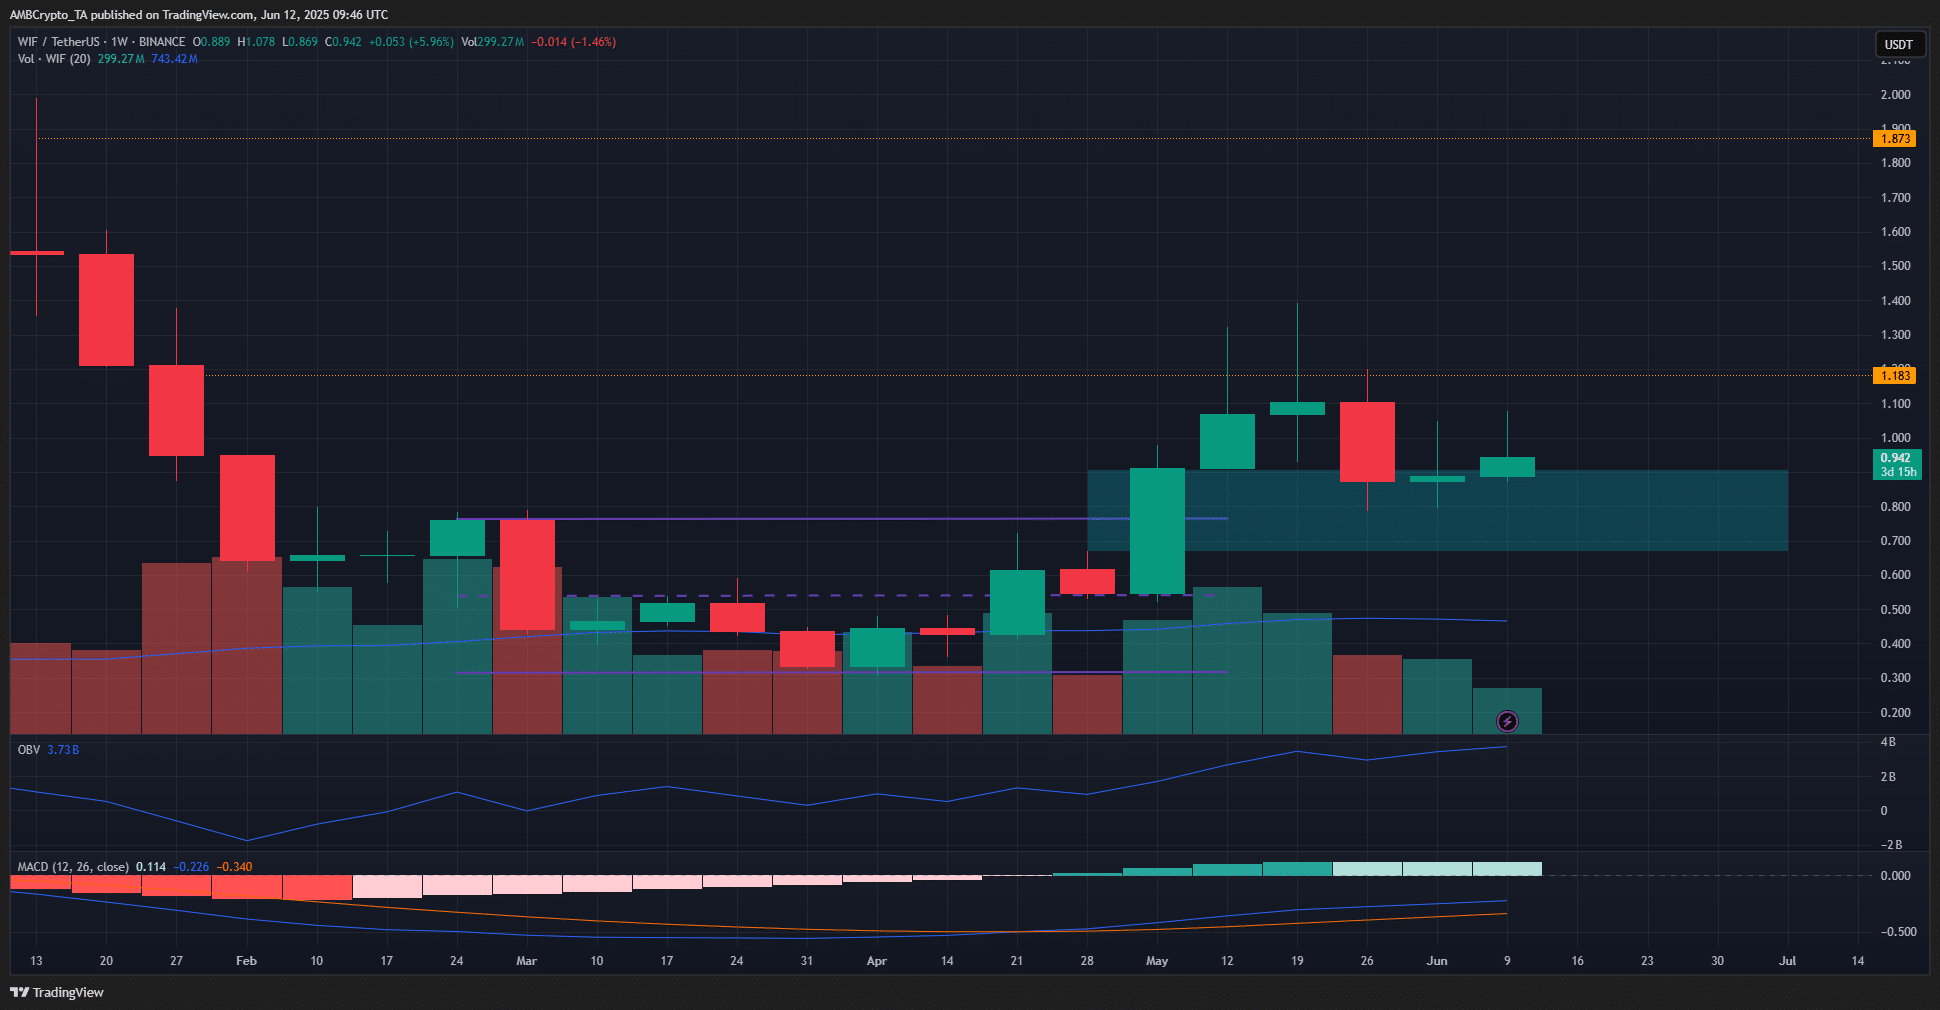
Source: WIF/USDT on TradingView
The 1-week chart showed a bullish structure break in the first week of May, when the $0.76 level was breached. The breakout left a fair value gap (cyan) between the $0.7 and $0.8 area.
This weekly FVG was an important demand zone. Over the past three weeks, the memecoin faced resistance at $1.2-$1.3 and reverted to this demand zone.
The recent price action showed dogwifhat bears were forced to respect this FVG and couldn’t drive prices lower.
The OBV also signaled steady buying pressure behind WIF, but this picture changed on the lower timeframes.
A lack of near-term direction
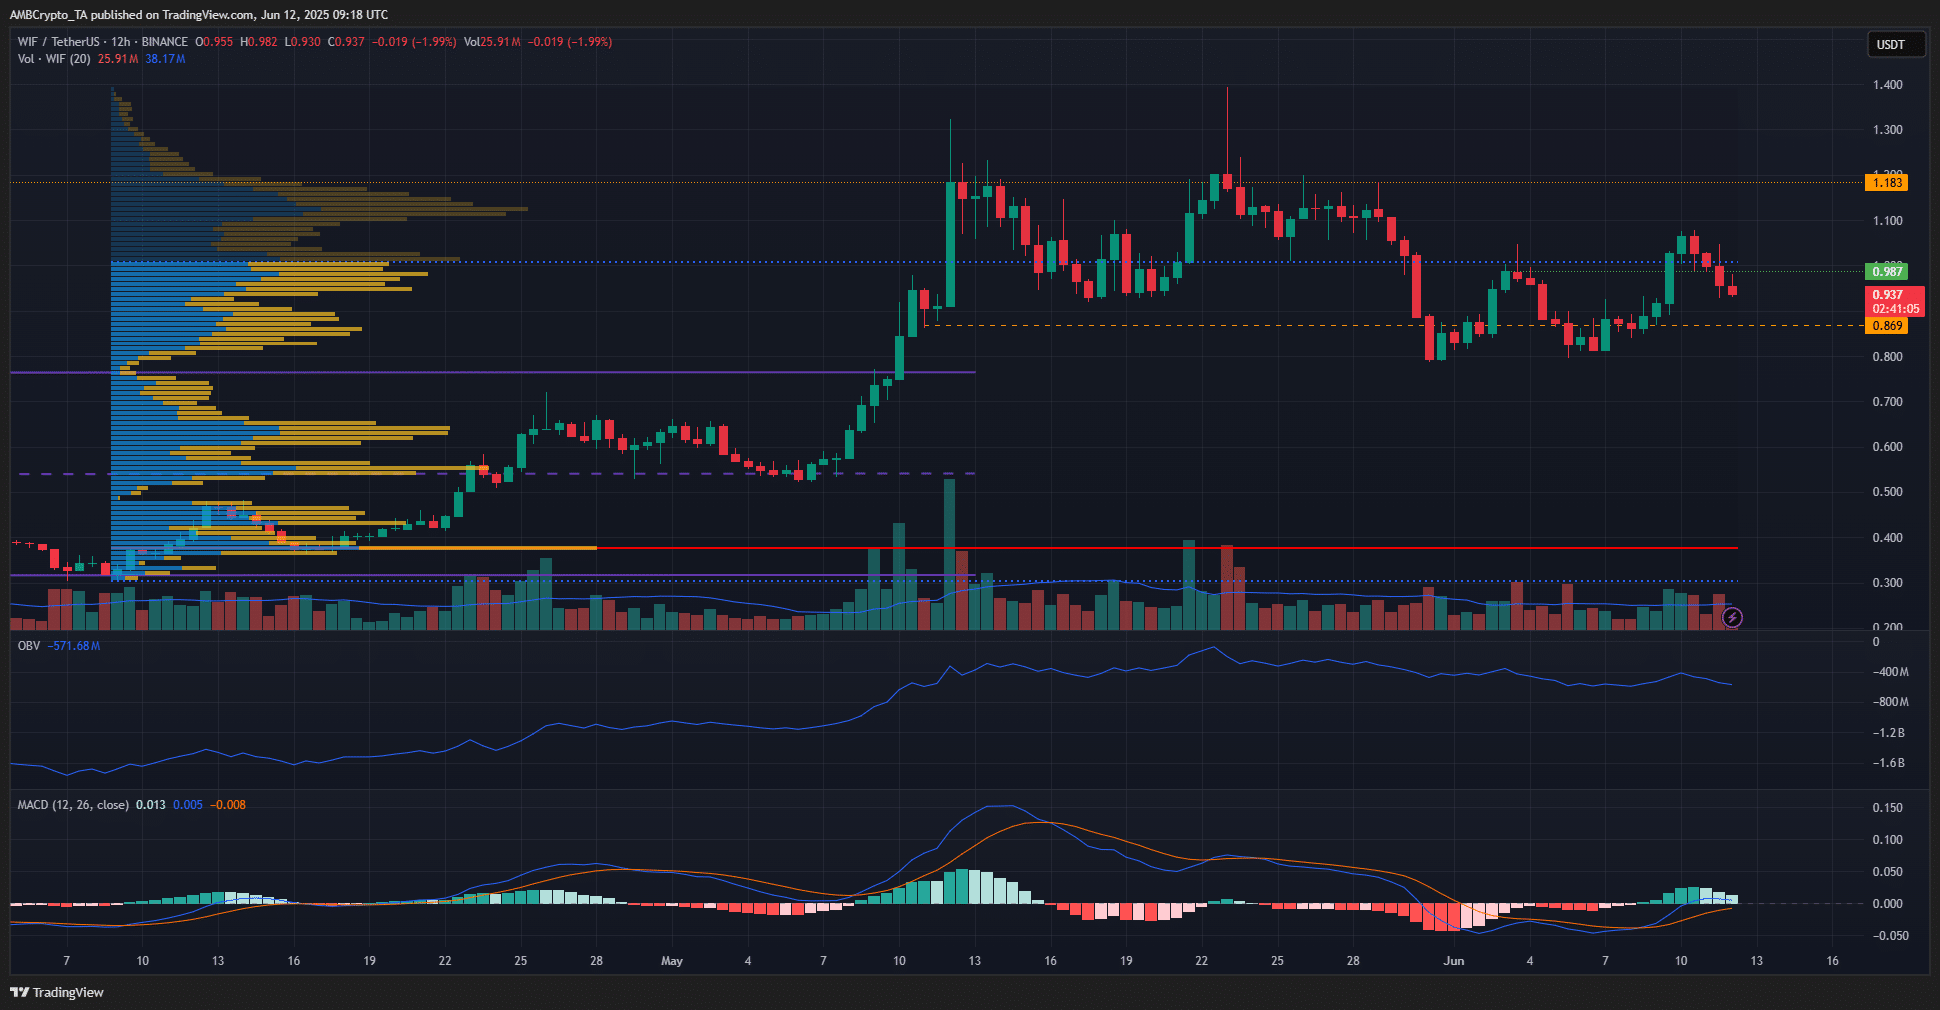
Source: WIF/USDT on TradingView
On the 12-hour chart, dogwifhat’s momentum last week failed to hold up over the past couple of days. The Bitcoin [BTC] rejection at $110k saw a 2.4% pullback in the past 24 hours.
This price drop affected WIF and the broader cryptocurrency market.
dogwifhat had achieved a bullish structure break with its recent move above the $0.987 level. This level was the previous high, marked from a 12-hour trading session close on the 3rd of June.
At the time of writing, the structure on the H12 chart was still bullish. However, the inability to stay above the $0.98-$1 supply zone was discouraging. Moreover, the OBV has been in a slow downtrend for three weeks.
This signaled steady selling pressure. The Fixed Range Volume Profile marked the psychological $1 level as the Value Area High (dotted blue). WIF bulls were unable to flip this level to support.
Combined with the descending OBV and lukewarm momentum recently, as per the OBV, it was likely that WIF would drop toward $0.8 next.
Disclaimer: The information presented does not constitute financial, investment, trading, or other types of advice and is solely the writer’s opinion