
Just like Bitcoin (BTC) before its rally, the price of Ethereum (ETH) may be on the verge of a significant breakout, as a key technical signal, known as the Raging Bull indicator, has just flipped in its favour. This same indicator previously predicted Bitcoin’s explosive surge to new all-time highs, and its reappearance for Ethereum is fueling fresh optimism.
Ethereum Reactivates Rare Bullish Indicator
On July 16, crypto analyst Tony Severino announced in a post on X social media that Ethereum has just flashed the critical Raging Bull indicator—a tool previously credited for accurately forecasting Bitcoin’s parabolic rally. This development, highlighted on the monthly chart, marks the potentially strongest confirmation of bullish momentum for ETH since its last major surge.
The analyst’s chart shows Ethereum closing the most recent monthly candle at $3,177, posting a 27.81% gain. This marks the first time the Raging Bull indicator has reappeared after months of absence since ETH bottomed out during the broader market correction in late 2022 and early 2023. The indicator, visible through yellow-highlighted candles, historically appeared during periods of strong upward trend formation on high time frames.
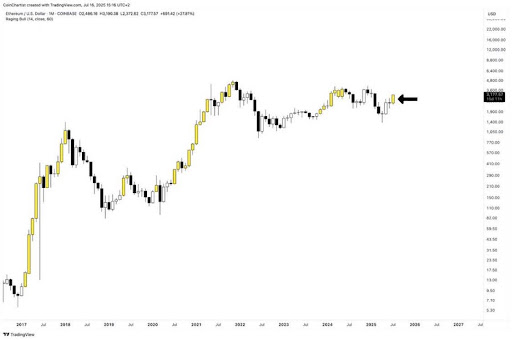
The last time Ethereum printed a similar pattern was during its famous 2020 breakout, which ultimately led to an explosive surge toward its ATH above $4,800. That run coincided with a sustained sequence of yellow candles backed by rising momentum. Based on this trend, the reappearance of the Raging Bull indicator suggests that Ethereum may be recovering from its 2022-2023 lows, highlighting the potential start of a renewed bullish phase.
Although Severino has not provided a specific price target or projection in his analysis report, the emergence of the key bullish signal on the high-timeframe chart potentially positions Ethereum in a bullish setup similar to the one Bitcoin was in when the same indicator flashed.
Bitcoin Price Action After The Raging Bull Flashed
According to a previous post, Severino revealed that Bitcoin’s Raging Bull indicator had reappeared earlier in May 2025, signaling for the first time since its last confirmed signal at the end of 2024. This technical development was marked on the weekly chart after a decisive candle close around the $97,452 level, marking a 3.91% gain.
The Raging Bull indicator first appeared during Bitcoin’s breakout in late 2023, with the momentum extending through the first half of 2024. After temporarily going dormant, the chart indicator flipped back on again around November 2024, preceding a major price rally. Its recent 2025 reappearance follows a recovery from local lows, forerunning an explosive surge in the BTC price.
Given its consistent activation during periods of uptrends, the Raging Bull signal has become a key indicator for a potential price expansion. Despite its claimed accuracy, Severino acknowledges that, like all trading systems, it is not perfect and can sometimes generate false signals.
Featured image from iStock, chart from Tradingview.com

Editorial Process for bitcoinist is centered on delivering thoroughly researched, accurate, and unbiased content. We uphold strict sourcing standards, and each page undergoes diligent review by our team of top technology experts and seasoned editors. This process ensures the integrity, relevance, and value of our content for our readers.