
Polygon has dropped nearly 10% over the past 24 hours, extending its downtrend for a third straight day. However, a bullish reversal pattern has emerged on the daily chart, indicating a potential rebound soon.
Summary
- Polygon’s POL token is down 9.5% in 24 hours, trading at $0.225 with a market cap of $2 billion.
- Whale holdings of POL rose 33% in 30 days as exchange balances dropped 4.5%.
- A double-bottom pattern and golden cross have formed on the daily chart.
According to data from crypto.news, POL (POL) was trading at $0.225, down 9.5% over the past 24 hours, with a market cap of $2 billion as of Thursday, July 24. This marks a 13.46% decline from its July high, likely driven by profit-taking from investors following the token’s rally alongside Bitcoin and Ethereum in recent weeks.
While the token of the Layer-2 scaling solution remains 56% below its year-to-date high, recent developments across the Polygon ecosystem suggest the network is regaining visibility and could benefit from renewed investor interest.
Fresh developments could revive investor interest
First, the Polygon team has recently announced it has become the blockchain infrastructure behind BeToken, Spain’s first fully EU-regulated, on-chain security token offering, marking a major step for real-world asset tokenization in Europe.
If the model sees broader adoption across the EU, it is likely to increase the volume of tokenized securities, stablecoin activity, and on-chain settlements on the Polygon network, thereby strengthening long-term demand for the POL token.
Second, sentiment around Polygon could also improve as Polymarket, the popular on-chain predictions market built on its network, is set to return to the U.S. after acquiring a CFTC-licensed derivatives exchange. The move comes after regulators closed an investigation that had forced the platform to block U.S. users since 2022.
With Polymarket transitioning from a regulatory gray area into full compliance, Polygon stands to benefit from increased transaction volume, user engagement, and greater visibility in the U.S. market.
On-chain metrics are bullish
On-chain metrics also present a positive outlook for Polygon. According to DeFiLlama data, the total market cap of stablecoins on the network has risen by 8%, reaching $2.9 billion as of press time.
Stablecoins form the backbone of most DeFi activity, and this increase suggests growing user demand and liquidity across the Polygon ecosystem, which could support a broader recovery for the POL token.
Whales have taken an interest in the token lately, with Nansen data indicating that the total balance of POL held by whale wallets has risen to 1.56 million tokens, a 33% increase over the past 30 days. At the same time, the total POL balance on exchanges has dropped by 4.5% to 1.23 billion tokens.
With whale accumulation rising and fewer tokens on exchanges, selling pressure may ease, setting the stage for an upside run.
POL price forms a double-bottom
On the daily chart, POL appears to be forming a textbook double-bottom pattern, typically regarded as a bullish reversal signal that forms after a prolonged downtrend. The neckline of the pattern is located at $0.2768, while the two bottoms are anchored near the $0.1637 level.
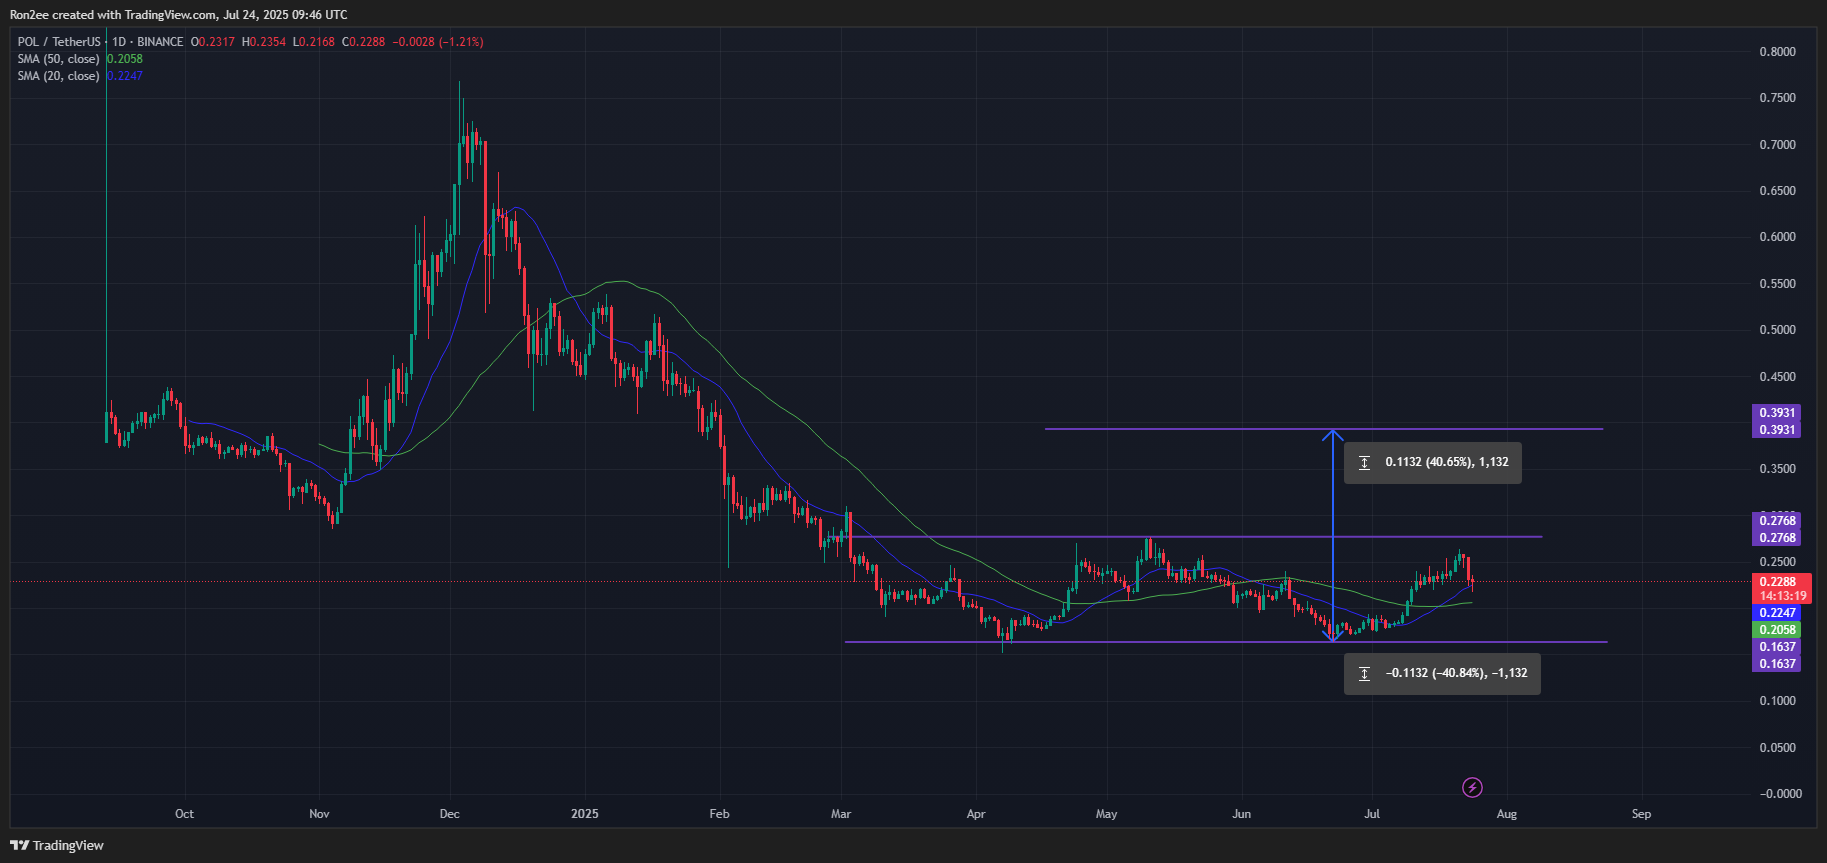
In addition, a golden cross has formed, with the 20-day simple moving average crossing above the 50-day moving average, an indication that short-term momentum may be shifting in favor of the bulls.
If bullish momentum persists, a breakout above the neckline resistance at $0.2768 could confirm the pattern and open the door for further upside.
Based on the pattern’s depth of approximately 40.6%, the projected price target stands at $0.393, implying a potential upside of around 78% from current levels. However, a decisive break below the key support at $0.20 would negate this setup and invalidate the bullish outlook.
Disclosure: This article does not represent investment advice. The content and materials featured on this page are for educational purposes only.