
Key Takeaways
ZORA crypto’s 36% rally coincides with a $105 million Open Interest spike and bullish derivatives activity, but heatmap and FVG signals hint at a trap setup, suggesting a 60–70% correction may soon follow.
Zora [ZORA] crypto posted a stunning 36% gain on the 27th of July, extending its four-week surge to 790%. Interestingly, market sentiment suggests ZORA’s rally may not be over yet.
Liquidity inflow has risen notably, while outflows have declined. Here’s a full breakdown of the factors that could influence ZORA’s continued rise.
Derivatives frenzy as Open Interest explodes
According to CoinGlass, ZORA recorded its highest single-day liquidity inflow into the derivatives market as of the 27th of July.
At press time, Open Interest jumped by $105.53 million, rising from $34.30 million to $139.83 million in just two days.
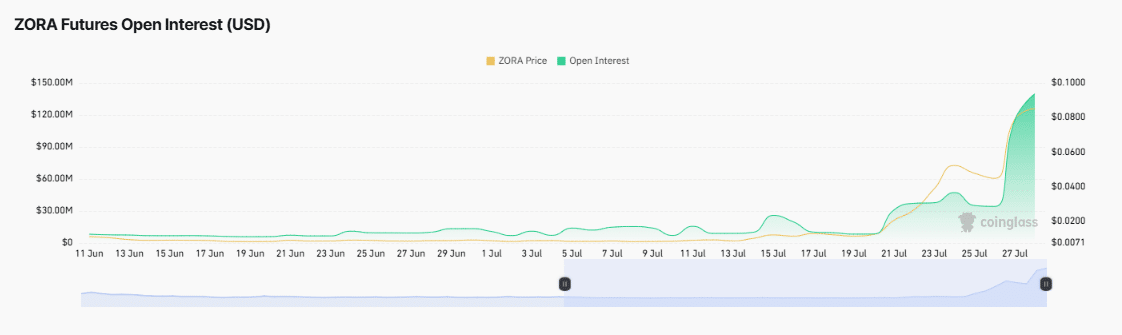
Source: CoinGlass
In fact, Spot market sentiment also pivoted.
While ZORA saw $9.41 million in outflows between the 26th and 27th of July, that pressure eased quickly, with net spot outflows shrinking to just $657.86K by the 28th of July.
This indicates that while derivative market inflows hit a new high, spot market participants have begun buying, showing a more optimistic outlook for the memecoin.
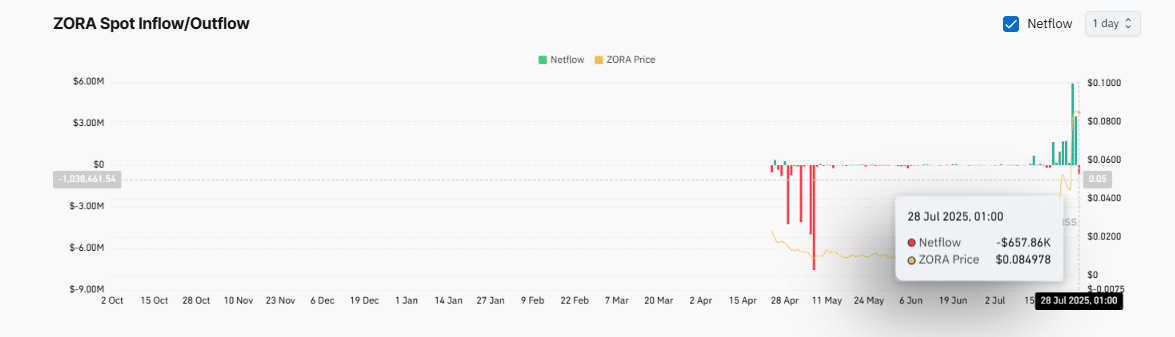
Source: CoinGlass
Binance leverage move sparks ZORA’s inflow rush
The latest liquidity surge follows Binance’s announcement of 50x leverage support for the ZORA/USDT pair, leading to a $230 million volume spike.
Moves like this typically boost market liquidity, especially during periods of high demand.
In fact, exchange data on CoinGlass also revealed that 7 out of 10 platforms are seeing higher buy volume at the moment, tilting the Long/Short Ratio across multiple exchanges in favor of buyers.
Bybit, MEXC, Bitget, and Hyperliquid [HYPE], all show over 50% of takers positioned long, with only Gate.io and Bitunix tilting slightly bearish.
Naturally, this setup supports a short-term continuation—but it may come at a cost.
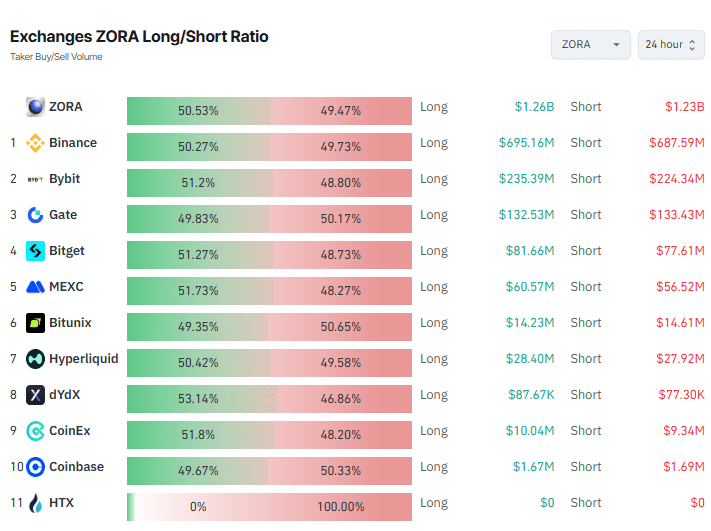
Source: CoinGlass
ZORA crash incoming?
AMBCrypto’s analysis of ZORA, using liquidity clusters and chart patterns, offers a fresh perspective—a warning sign.
The memecoin could initially trend higher, potentially clearing the demand zone positioned above the current price or trading into the demand clusters around $0.08, which could further propel the price upward.
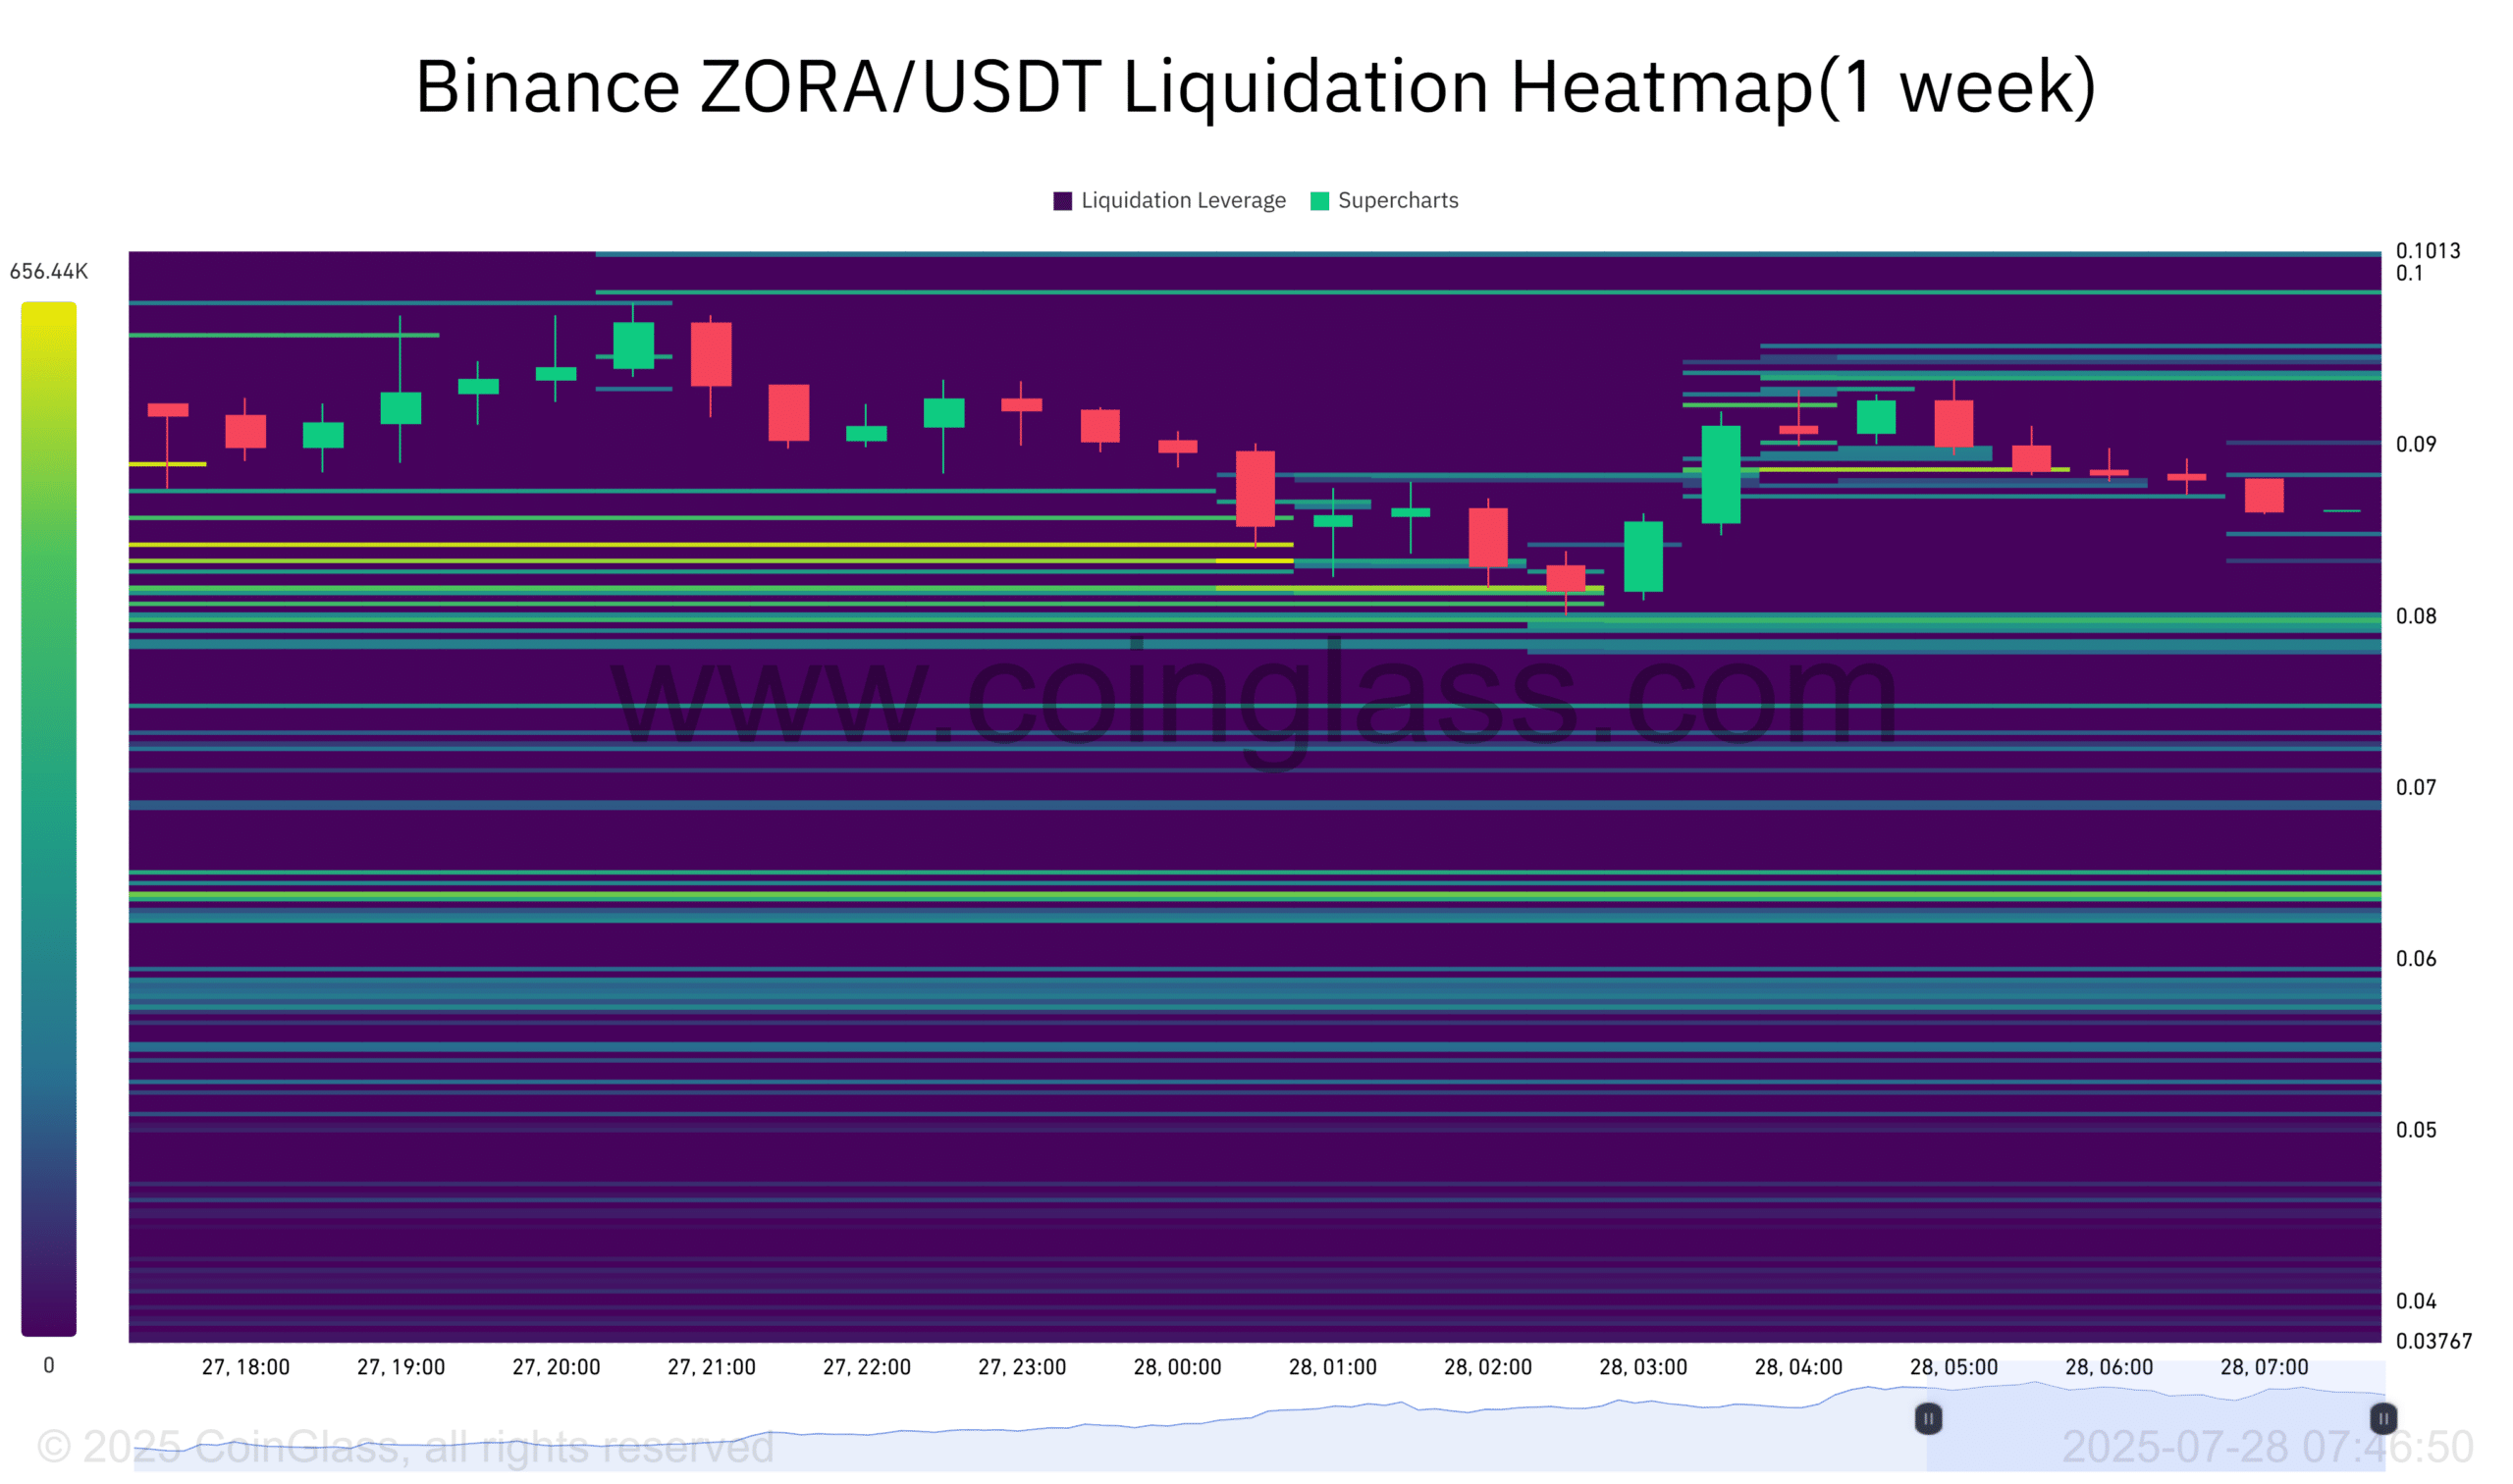
Source: CoinGlass
Interestingly, this move could serve as a bull trap before a much steeper decline, forcing market participants to place buy orders just before a reversal, clearing out liquidity levels below the current price.
Price analysis suggests that ZORA’s decline could extend downward by as much as 70%, based on the placement of the Fair Value Gap (FVG).
The first FVG is positioned between $0.069 and $0.065—a drop into this level from its local high would mark a 40% decline.
In that case, the next probable demand FVG lies between $0.029 and $0.035, making it the next target for price and marking a potential 66% to 70% drop.
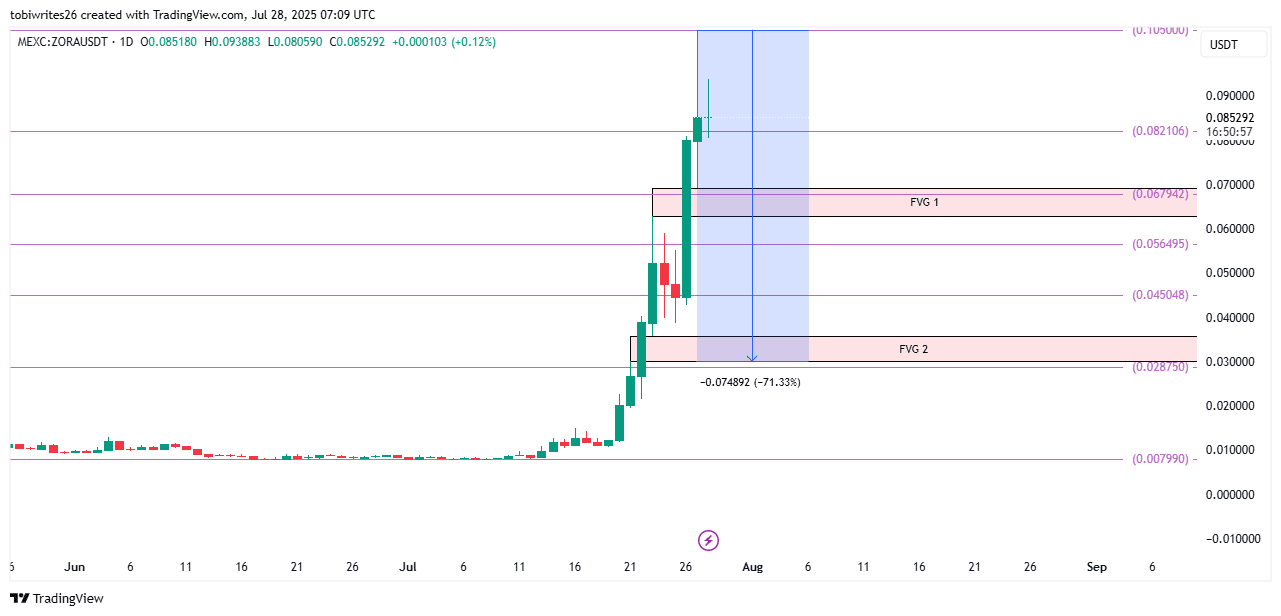
Source: TradingView
Typically, a corrective drop to the 60% region aligns with historical Fibonacci Retracement levels, which often act as catalysts for a rebound.