Close Menu
    What's Hot

    $1B flows into XRP ETFs, yet price refuses to move – Here’s why!

    FARTCOIN draws smart money interest, yet price stays trapped – Why?

    BRETT holders should hold their breath — new data shows 80% insider accumulation at launch

    Facebook X (Twitter) Instagram
    yeek.io
    • Crypto Chart
    • Crypto Price Chart
    X (Twitter) Instagram TikTok
    Trending Topics:
    • Altcoin
    • Bitcoin
    • Blockchain
    • Crypto News
    • DeFi
    • Ethereum
    • Meme Coins
    • NFTs
    • Web 3
    yeek.io
    • Altcoin
    • Bitcoin
    • Blockchain
    • Crypto News
    • DeFi
    • Ethereum
    • Meme Coins
    • NFTs
    • Web 3
    Meme Coins

    BONK price prediction – Traders, look out for volumes and Bitcoin’s trends!

    Yeek.ioBy Yeek.ioAugust 25, 2025No Comments3 Mins Read
    Share Facebook Twitter Pinterest Copy Link Telegram LinkedIn Tumblr Email
    Share
    Facebook Twitter LinkedIn Pinterest Email

    Key Takeaways

    A confluence of factors meant that even though BONK exhibited bearish momentum, it could see a bullish trend reversal soon. The one factor not in favor of the bulls was the buying volume in recent weeks.


    Bonk [BONK], at the time of writing, was trading at a zone of support that launched its rally to $0.00004 in July. In fact, the memecoin has retraced by 44% since hitting those highs last month.

    The bearish short-term Bitcoin [BTC] bias suggested that BONK traders should be wary of further losses.

    Source: BTC.D on TradingView

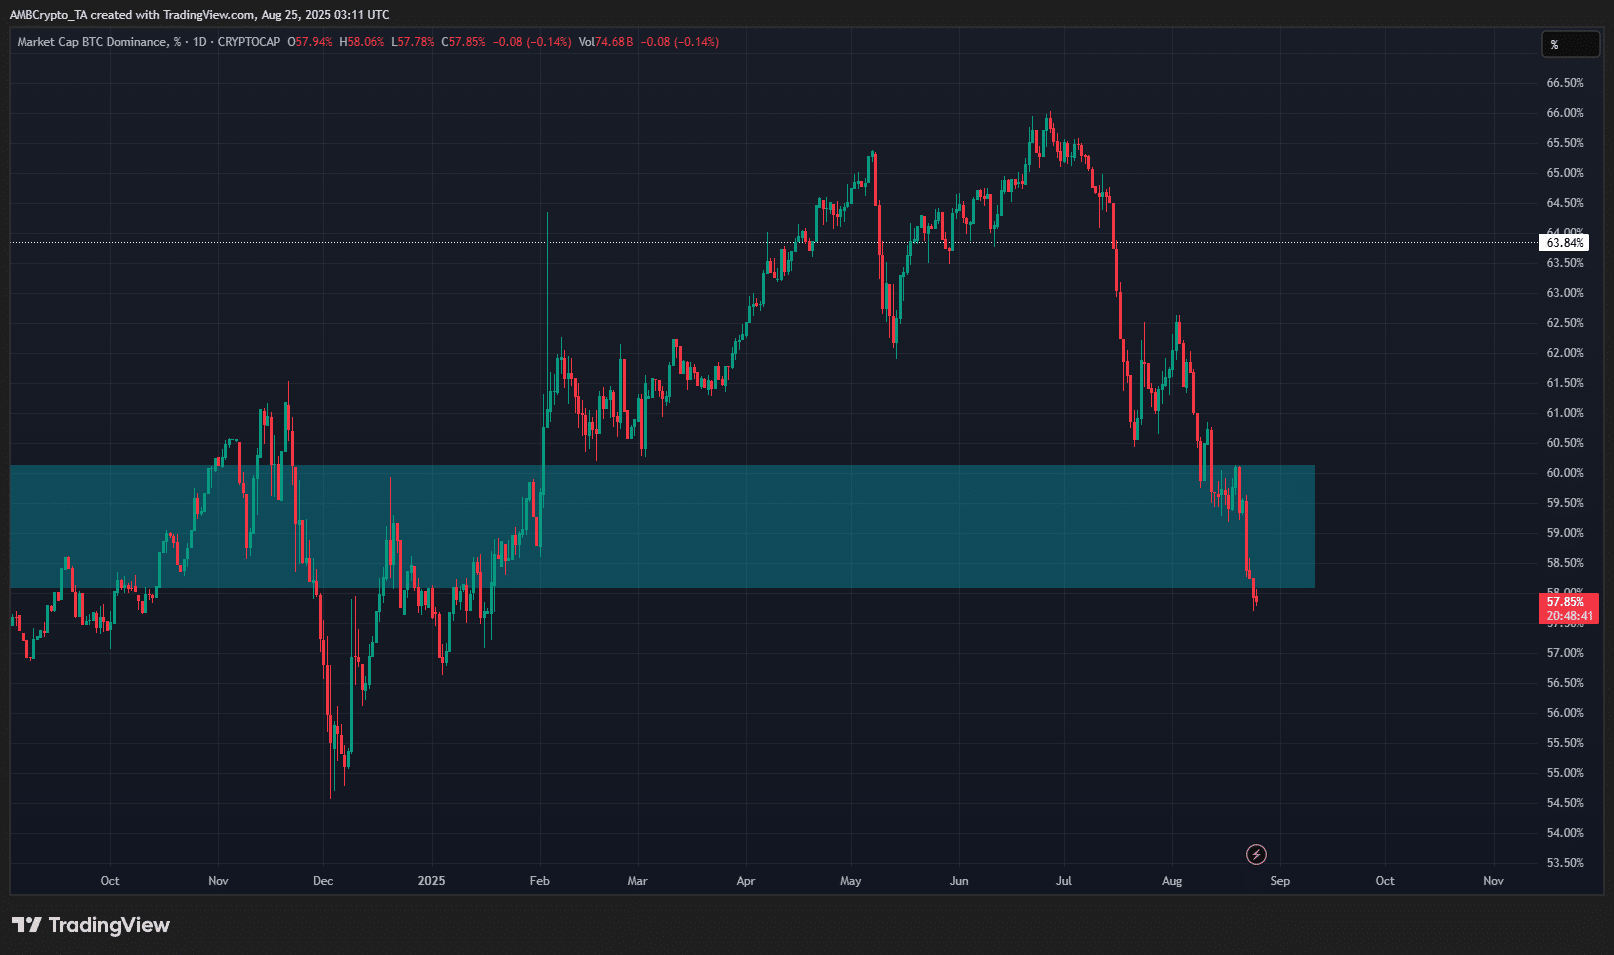
    Bitcoin‘s Dominance has been dropping in recent weeks. At press time, it was below a zone of support (cyan) from September 2020. A sustained downtrend in the BTC.D would be good for the altcoin market, including the memecoin sector.

    This implied that the altcoin market cap may be expanding faster than Bitcoin’s – A sign of capital flow into altcoins. The memecoin market cap has been slowly growing since March. With a value of $71.41 billion though, it’s still a sizeable distance from the $115-billion mark it reached in late 2024.

    What should you expect from BONK next?

    BONK 1-day Chart

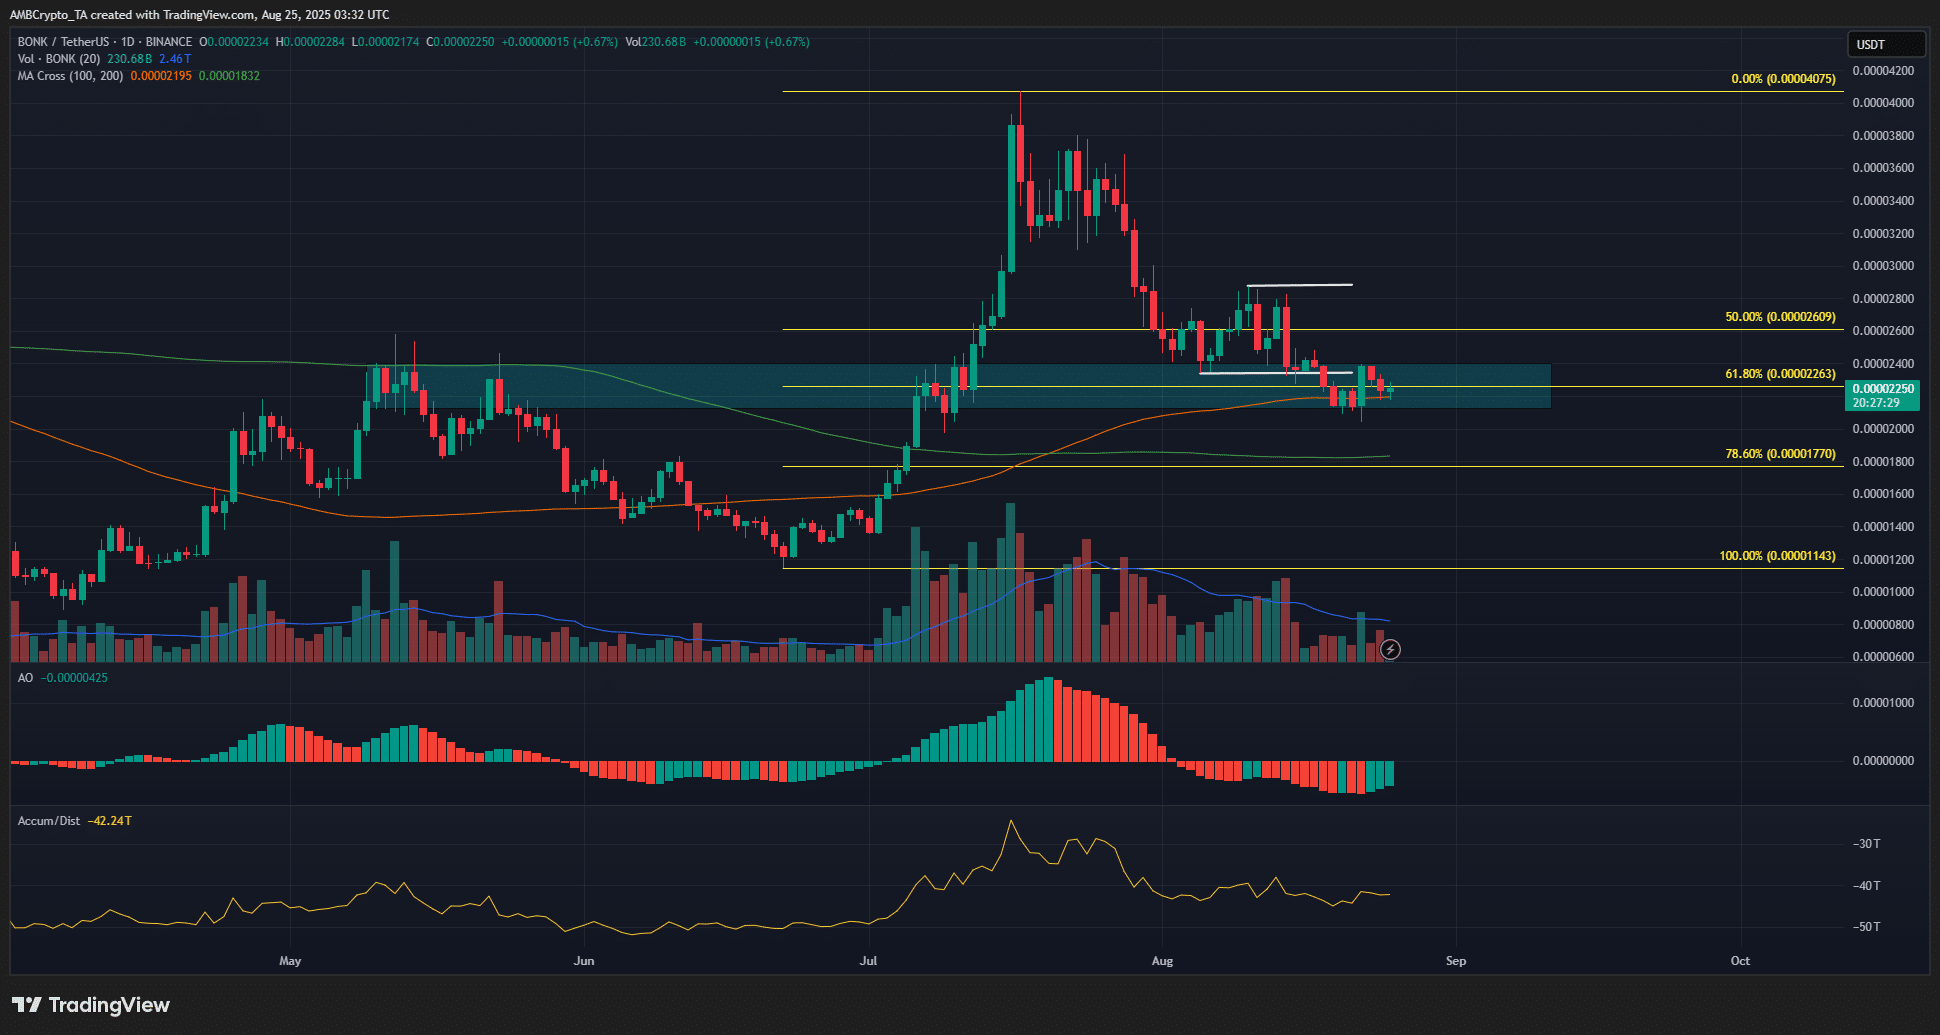
    Source: BONK/USDT on TradingView

    On the 1-day chart, the internal structure was bearish. The previous swing points were marked in white, and BONK made a new lower low in August. Hence, the bias for the coming days appeared bearish. The Awesome Oscillator was moving below the zero line, underlining the bearish momentum in the market.

    However, the memecoin was trading at a bullish breaker block from May. The $0.0000225-area had served as resistance during July’s rally. This meant that a retest could find support here.

    The Fibonacci retracement levels plotted showed that the 61.8% level was at $0.000226. The 100-day moving average was also within this zone. This combination of factors meant that BONK was trading at a key long-term support zone.

    Traders and investors should be alert for a bullish reversal. One concern might be the decline in trading volume over recent days though, something that was also reflected in the A/D indicator. This needs to change for BONK to establish an uptrend.

    Disclaimer: The information presented does not constitute financial, investment, trading, or other types of advice and is solely the writer’s opinion

    Previous: SPX6900 surges 12%, but SPX’s latest rally looks short-lived – Why?
    Next: Inside the Aave – WLFI proposal: Rumors, revenue sharing, and governance?

    Follow on Google News Follow on Flipboard
    Share. Facebook Twitter Pinterest LinkedIn Tumblr Email Copy Link
    Previous ArticlePhilippines reviewing bill to create Strategic Bitcoin Reserve with 10,000 BTC
    Next Article Ethereum price down after new all-time high above $4,900, can it crash?
    Avatar
    Yeek.io
    • Website

    Yeek.io is your trusted source for the latest cryptocurrency news, market updates, and blockchain insights. Stay informed with real-time updates, expert analysis, and comprehensive guides to navigate the dynamic world of crypto.

    Related Posts

    $1B flows into XRP ETFs, yet price refuses to move – Here’s why!

    December 14, 2025

    FARTCOIN draws smart money interest, yet price stays trapped – Why?

    December 13, 2025

    BRETT holders should hold their breath — new data shows 80% insider accumulation at launch

    December 12, 2025
    Leave A Reply Cancel Reply

    Advertisement
    Demo
    Latest Posts

    $1B flows into XRP ETFs, yet price refuses to move – Here’s why!

    FARTCOIN draws smart money interest, yet price stays trapped – Why?

    BRETT holders should hold their breath — new data shows 80% insider accumulation at launch

    Shiba Inu Coin rebound looms as whales suddenly buy

    Popular Posts
    Advertisement
    Demo
    X (Twitter) TikTok Instagram

    Categories

    • Altcoin
    • Bitcoin
    • Blockchain
    • Crypto News

    Categories

    • Defi
    • Ethereum
    • Meme Coins
    • Nfts

    Quick Links

    • Home
    • About
    • Contact
    • Privacy Policy

    Important Links

    • Crypto Chart
    • Crypto Price Chart
    © 2025 Yeek. All Copyright Reserved

    Type above and press Enter to search. Press Esc to cancel.