Close Menu
    What's Hot

    Ethereum Prepares For A Parabolic Move – ETH/BTC Chart Signals Strong Bullish Setup

    Ethereum Enters Strategic Pause: Will Accumulation Below Resistance Spark A Surge?

    Solana indicators point north, bulls test $165 target

    Facebook X (Twitter) Instagram
    yeek.io
    • Crypto Chart
    • Crypto Price Chart
    X (Twitter) Instagram TikTok
    Trending Topics:
    • Altcoin
    • Bitcoin
    • Blockchain
    • Crypto News
    • DeFi
    • Ethereum
    • Meme Coins
    • NFTs
    • Web 3
    yeek.io
    • Altcoin
    • Bitcoin
    • Blockchain
    • Crypto News
    • DeFi
    • Ethereum
    • Meme Coins
    • NFTs
    • Web 3
    Ethereum

    Ethereum Price Is About To Confirm A Golden Cross On The Daily Time Frame, Here’s What Happened Last Time

    Yeek.ioBy Yeek.ioDecember 4, 2024No Comments3 Mins Read
    Share Facebook Twitter Pinterest Copy Link Telegram LinkedIn Tumblr Email
    Share
    Facebook Twitter LinkedIn Pinterest Email

    Este artículo también está disponible en español.

    Crypto analysts have revealed that the Ethereum price is about to confirm a golden cross on the daily time frame. This provides a bullish outlook for Ethereum, as it enjoyed a parabolic rally the last time this happened. 

    Ethereum Price To Confirm Golden Cross, What Next?

    In an X post, crypto analyst Tony Severino mentioned that the Ethereum price is heading to a golden cross this week. This golden cross occurs when a short-term moving average (MA), like the 50-day MA, crosses a long-term MA, like the 200-day MA. This typically indicates that the crypto in question is set to enjoy a long-term upward trend. 

    Related Reading

    Source: X

    Crypto analyst Charting Guy also confirmed this development for the Ethereum price and provided insights into what happened the last time Ethereum witnessed this golden cross. In an X post, the crypto analyst shared a chart that showed what happened combined with the fractal from that time. 

    Ethereum price 2
    Source: X

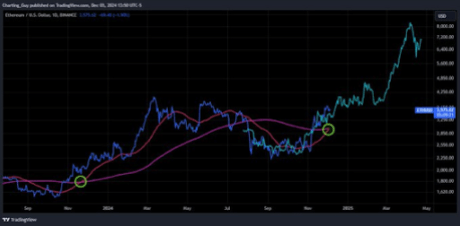
    Coincidentally, the last time the Ethereum price confirmed this golden cross on the daily timeframe was between November and December last year. Following the Golden Cross, Ethereum rallied from around $1,800 last year to a local top of around $3,600 in March earlier this year. 

    If history were to repeat itself, the Ethereum price could again witness such a sustained upward trend into the new year. Charting Guy’s accompanying chart showed that Ethereum could rally to as high as $8,000 sometime between March and May next year. Ethereum is already showing signs of an upward momentum, having rallied these last few days while Bitcoin consolidates. 

    The Ethereum price has already reclaimed the local top of $3,600 from earlier in the year. Meanwhile, Blockchain Center data shows that it is already altcoin season. This is when Ethereum and other altcoins record significant gains while Bitcoin’s dominance cools off. For context, over 75% of the top 50 crypto have outperformed BTC in the last 90 days. 

    Breakout And Then Moon

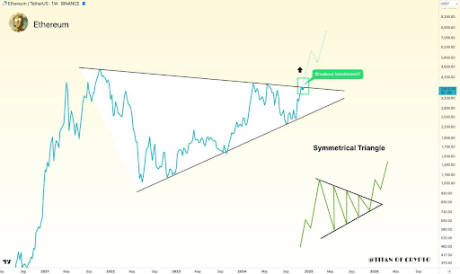
    In an X post, crypto analyst Titan of Crypto suggested that an Ethereum price breakout was imminent. He stated that once ETH escapes the 3-year symmetrical triangle, it will rally to new heights. The analyst’s accompanying chart showed that Ethereum could surpass its current all-time high (ATH) at $4,800 and rally as high as $7,000. 

    Related Reading

    Ethereum price 3
    Source: X

    Crypto analyst Venture Founder also made a similar $7,000 prediction for the Ethereum price. This came as he highlighted a giant cup and handle triangle that has been forming for Ethereum since 2021. The analyst added that ETH could explode once it confirms the breakout above the $3,800 range. 

    At the time of writing, the Ethereum price is trading at around $3,670, up in the last 24 hours, according to data from CoinMarketCap. 

    Ethereum price chart from Tradingview.com
    ETH price breaks above $3,700 | Source: ETHUSDT on Tradingview.com

    Featured image created with Dall.E, chart from Tradingview.com

    Follow on Google News Follow on Flipboard
    Share. Facebook Twitter Pinterest LinkedIn Tumblr Email Copy Link
    Previous ArticleSuiPlay Introduces Perks with Eternal NFTs and Airdrop Rewards
    Next Article The Ultimate Crypto Wallet Guide for 2025: The Best Wallet
    Avatar
    Yeek.io
    • Website

    Yeek.io is your trusted source for the latest cryptocurrency news, market updates, and blockchain insights. Stay informed with real-time updates, expert analysis, and comprehensive guides to navigate the dynamic world of crypto.

    Related Posts

    Ethereum Prepares For A Parabolic Move – ETH/BTC Chart Signals Strong Bullish Setup

    June 8, 2025

    Ethereum Enters Strategic Pause: Will Accumulation Below Resistance Spark A Surge?

    June 8, 2025

    Solana indicators point north, bulls test $165 target

    June 7, 2025
    Leave A Reply Cancel Reply

    Advertisement
    Demo
    Latest Posts

    Ethereum Prepares For A Parabolic Move – ETH/BTC Chart Signals Strong Bullish Setup

    Ethereum Enters Strategic Pause: Will Accumulation Below Resistance Spark A Surge?

    Solana indicators point north, bulls test $165 target

    Cardano is at the Nexus of Bitcoin DeFi: Charles Hoskinson

    Popular Posts
    Advertisement
    Demo
    X (Twitter) TikTok Instagram

    Categories

    • Altcoin
    • Bitcoin
    • Blockchain
    • Crypto News

    Categories

    • Defi
    • Ethereum
    • Meme Coins
    • Nfts

    Quick Links

    • Home
    • About
    • Contact
    • Privacy Policy

    Important Links

    • Crypto Chart
    • Crypto Price Chart
    © 2025 Yeek. All Copyright Reserved

    Type above and press Enter to search. Press Esc to cancel.