Close Menu
    What's Hot

    Ethereum Prepares For A Parabolic Move – ETH/BTC Chart Signals Strong Bullish Setup

    Ethereum Enters Strategic Pause: Will Accumulation Below Resistance Spark A Surge?

    Solana indicators point north, bulls test $165 target

    Facebook X (Twitter) Instagram
    yeek.io
    • Crypto Chart
    • Crypto Price Chart
    X (Twitter) Instagram TikTok
    Trending Topics:
    • Altcoin
    • Bitcoin
    • Blockchain
    • Crypto News
    • DeFi
    • Ethereum
    • Meme Coins
    • NFTs
    • Web 3
    yeek.io
    • Altcoin
    • Bitcoin
    • Blockchain
    • Crypto News
    • DeFi
    • Ethereum
    • Meme Coins
    • NFTs
    • Web 3
    Ethereum

    Ethereum To $10,000: Analyst Reveals Mid & Long-Term ETH Targets

    Yeek.ioBy Yeek.ioDecember 5, 2024No Comments3 Mins Read
    Share Facebook Twitter Pinterest Copy Link Telegram LinkedIn Tumblr Email
    Share
    Facebook Twitter LinkedIn Pinterest Email

    An analyst has placed these mid-term and long-term targets for Ethereum based on an Ascending Parallel Channel that has been forming in its weekly price.

    Ethereum Has Been Traveling Inside An Ascending Channel For A While Now

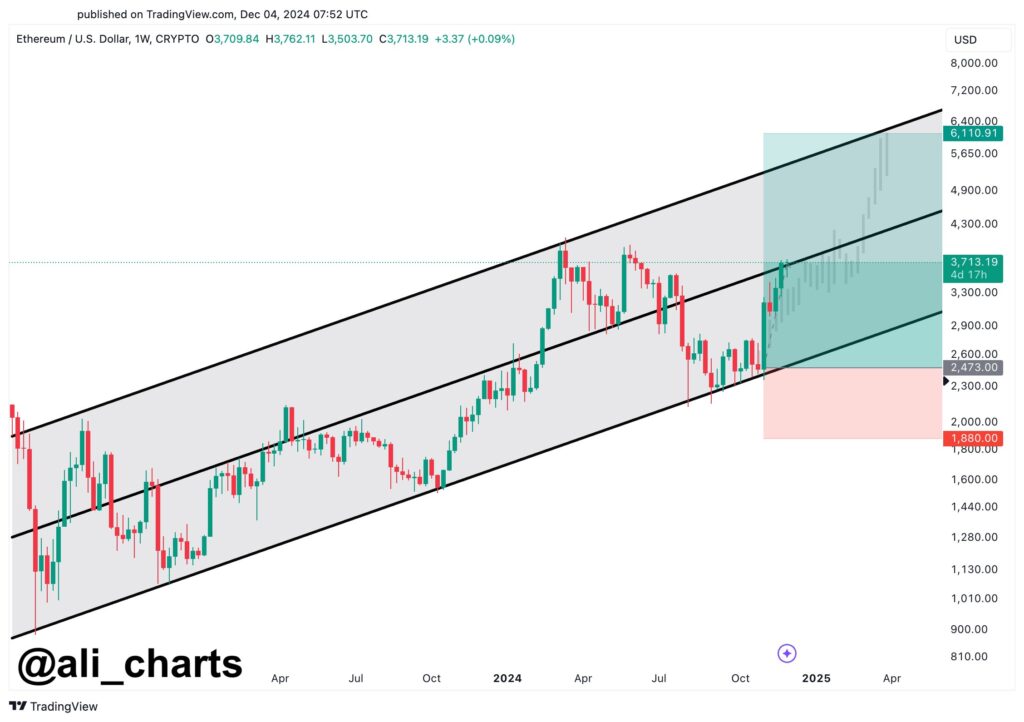
    In a new post on X, analyst Ali Martinez has discussed where ETH could be heading next based on a pattern forming in its weekly price chart. The pattern in question is the Ascending Channel from technical analysis, which is a type of Parallel Channel.

    A Parallel Channel is made up of two parallel trendlines between which the price of the asset consolidates. The upper line of the pattern is created by joining together successive tops, while the lower one connects bottoms.

    When the coin is inside the channel, it’s likely to feel resistance at the former level and support at the latter. A break out of either of these lines can imply a continuation of the trend in that direction.

    The usual Parallel Channel is also parallel to the time-axis. When it’s not, it’s either an Ascending Channel or a Descending Channel. As their names already suggest, the former involves parallel trendlines that are slopped upwards, while the latter has a decline.

    This means that these patterns capture consolidations towards the upside and the downside, respectively. Ethereum has been stuck inside one such pattern recently, as the 1-week price chart for the cryptocurrency shared by the analyst highlights.

    As is visible in the above graph, the Ethereum weekly price has been moving inside an Ascending Channel for a couple of years now. The asset retested the lower level of the pattern earlier in the year and successfully found support at it, thanks to which its price has been able to see a sharp bullish rebound.

    The coin is now about halfway through the channel, which means there is plenty of distance to go before a retest of the upper level. However, the asset can still find resistance here. “If #Ethereum $ETH experiences a pullback, keep an eye on the $3,300 support level — a potential buying opportunity,” notes Martinez.

    The last time ETH broke past the midway point of the channel was in the first quarter of the year, when the coin went all the way to the upper level. Thus, if Ethereum can overcome this challenge, it’s possible that it may witness a similar rally this time as well.

    “Our mid-term target remains $6,000, with a long-term outlook of $10,000!” explains the analyst. From the current price, a potential surge to the first of these targets would imply an increase of 62%, while that to the second one would be 170%.

    ETH Price

    At the time of writing, Ethereum is trading at around $3,700, up almost 8% over the last week.

    Ethereum Price Chart

    Follow on Google News Follow on Flipboard
    Share. Facebook Twitter Pinterest LinkedIn Tumblr Email Copy Link
    Previous ArticleWill Trump’s crypto plans boost or break the US dollar?
    Next Article PancakeSwap Trading Volume Surges to $1.27 Billion
    Avatar
    Yeek.io
    • Website

    Yeek.io is your trusted source for the latest cryptocurrency news, market updates, and blockchain insights. Stay informed with real-time updates, expert analysis, and comprehensive guides to navigate the dynamic world of crypto.

    Related Posts

    Ethereum Prepares For A Parabolic Move – ETH/BTC Chart Signals Strong Bullish Setup

    June 8, 2025

    Ethereum Enters Strategic Pause: Will Accumulation Below Resistance Spark A Surge?

    June 8, 2025

    Solana indicators point north, bulls test $165 target

    June 7, 2025
    Leave A Reply Cancel Reply

    Advertisement
    Demo
    Latest Posts

    Ethereum Prepares For A Parabolic Move – ETH/BTC Chart Signals Strong Bullish Setup

    Ethereum Enters Strategic Pause: Will Accumulation Below Resistance Spark A Surge?

    Solana indicators point north, bulls test $165 target

    Cardano is at the Nexus of Bitcoin DeFi: Charles Hoskinson

    Popular Posts
    Advertisement
    Demo
    X (Twitter) TikTok Instagram

    Categories

    • Altcoin
    • Bitcoin
    • Blockchain
    • Crypto News

    Categories

    • Defi
    • Ethereum
    • Meme Coins
    • Nfts

    Quick Links

    • Home
    • About
    • Contact
    • Privacy Policy

    Important Links

    • Crypto Chart
    • Crypto Price Chart
    © 2025 Yeek. All Copyright Reserved

    Type above and press Enter to search. Press Esc to cancel.