
As Bitcoin finally soars above the long-awaited $100,000 milestone, Ethereum (ETH) attempts to break out from a key resistance zone. The second-largest crypto rally has fueled optimism about its targets, with some suggesting that it could mimic BTC’s 2020-2021 rally.
Related Reading
Ethereum Reclaims $3,900
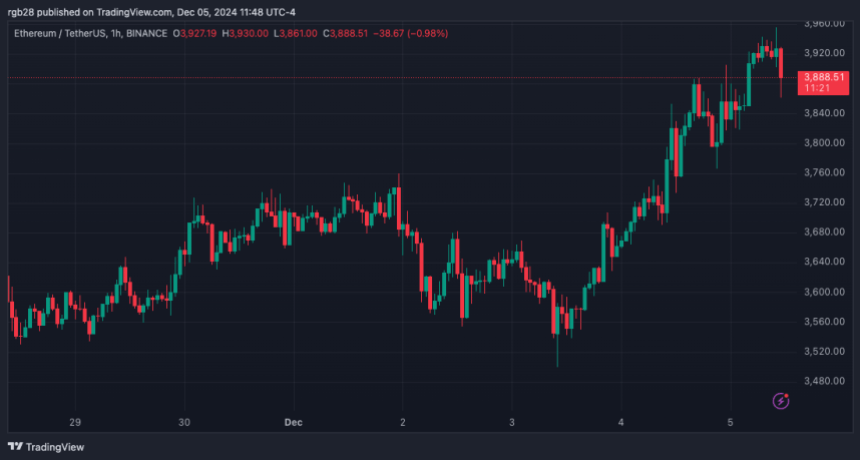
Ethereum, the second-largest cryptocurrency by market capitalization, has recorded a 10% surge in the past week, moving from the $3,500 mark to the $3,900 resistance. On Wednesday, the King of Altcoins surpassed the $3,800 level for the first time in six months and continued climbing to retest the $3,900 resistance, not seen since early March.
In the early hours of Thursday, ETH turned this key zone into support, briefly dipping to $3,860 before jumping back to the recently reclaimed level. As the cryptocurrency nears its yearly high of $4,093, sentiment around the token’s short-term performance has turned extremely bullish.
Ethereum is retesting a massive multi-year resistance zone, which could send ETH to a new ATH. According to analyst Alex Clay, the cryptocurrency attempts to break “through the Key Resistance Zone on the weekly timeframe.”
ETH has rested the key zone five times since 2021, facing rejection from the upper resistance at $3,950 on four occasions before. However, Ethereum broke past this level in late 2021, when it hit its all-time high (ATH) and held above it for nearly three months.
The analyst noted that if the King of Altcoins successfully breaks above this level and turns it into support, it will be the next “to break through” and smash its ATH. Clay added that he sees “no major pullback in the near time.”
Similarly, crypto analyst Jelle stated that if Ethereum breaks above the March high, “all bets are off,” suggesting that the chances of ETH taking a long consolidation period before a new ATH like BTC did were “very low.”
ETH To Rally Toward $10,000?
Jelle also noted that Ethereum’s current setup mimicked Bitcoin’s in July 2020. Per the chart, Bitcoin broke through a multi-year downtrend line by mid-2020, followed by a massive 500% 10-month rally toward the $60,000 mark in April 2021.
The analyst noted that ETH breached the multi-year trendline today, like BTC in 2020, which could trigger a similar rally toward new highs in the next few months. He added that investors are “in for a treat if this plays out anything similar.”
In another post, he highlighted that Ethereum started rallying when Bitcoin broke its ATH and entered price discovery when BTC traded nearly 100% above its previous cycle high.
Related Reading
He considers that it would be surprising to “see things play out similarly this time around. BTC & ETH climbing in tandem, leading to ETH entering price discovery somewhere around ±$130,000.”
Based on this, the analyst believes that a 150-200% rally toward the $10,000-$12,000 price range for the cryptocurrency is possible for this cycle. As of this writing, ETH is trading at $3,905, a 2.4% increase in the daily timeframe.
Featured Image from Unsplash.com, Chart from TradingView.com