
- PEPE has continued its positive uptrend after its decline on 05 December
- Memecoin’s market remains torn between longs and shorts
PEPE’s funding rate has seen dramatic shifts over the last 24 hours, underscoring the heightened volatility across the memecoin’s market.
Despite these fluctuations, however, the token’s price has moved positively on the price charts. In fact, analysts are closely watching its funding rates, Open Interest (OI), and broader market sentiment to anticipate its next moves.
PEPE’s funding rate swings and price correlation
An analysis of PEPE’s funding rate data revealed significant spikes, coinciding with its price hovering near the $0.000002200-mark. The chart showed that after a sharp drop to around 0.0309% during the last trading session, it spiked to 0.0800% at press time.
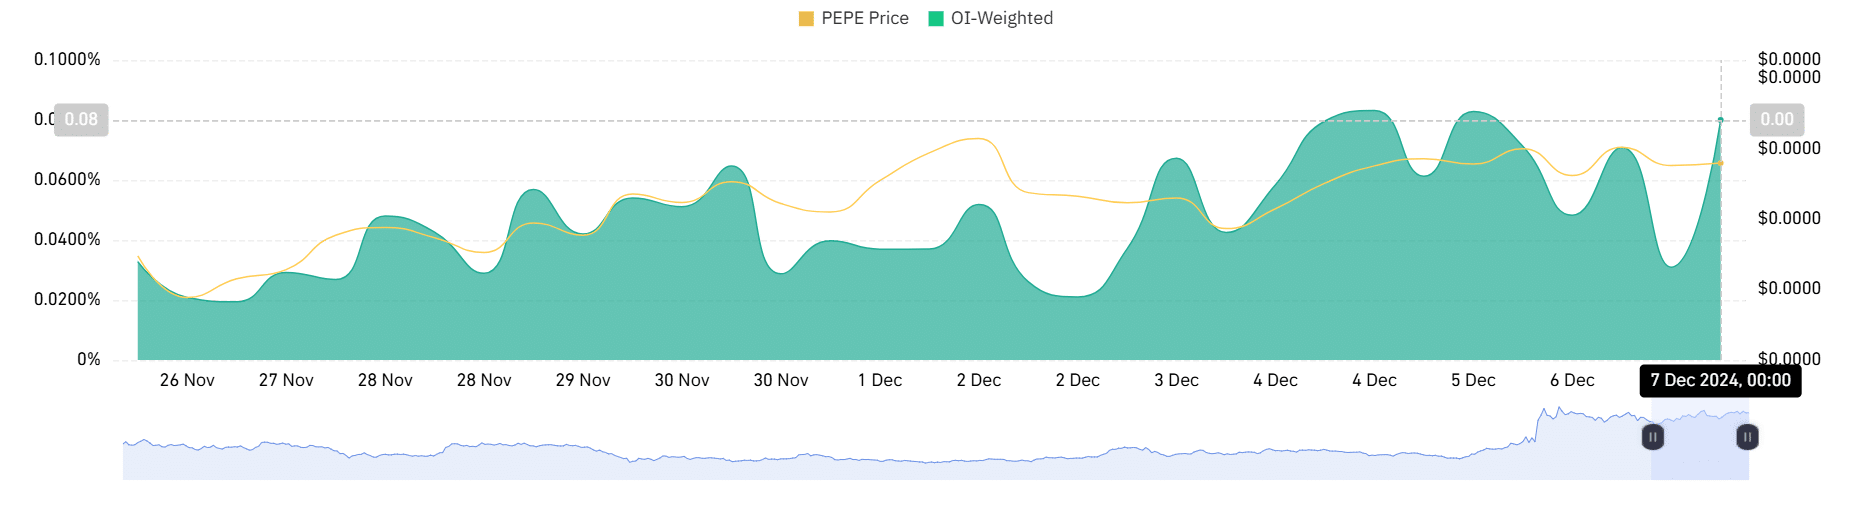
Source: Coinglass
These sharp movements often indicate a tug-of-war between long and short positions.
Historically, extreme shifts in funding rates have preceded price corrections or upward momentum, depending on the prevailing market sentiment. At press time, the funding rates suggested a heightened speculative environment.
Also, the Long/Short Ratio’s chart analysis highlighted a near-parity between long and short positions, hovering at around 1.03. This indicated a delicate equilibrium, one where neither bulls nor bears seemed to have a clear upper hand.
Historically, a slight tilt in this ratio and funding rate volatility often precedes decisive price movements.
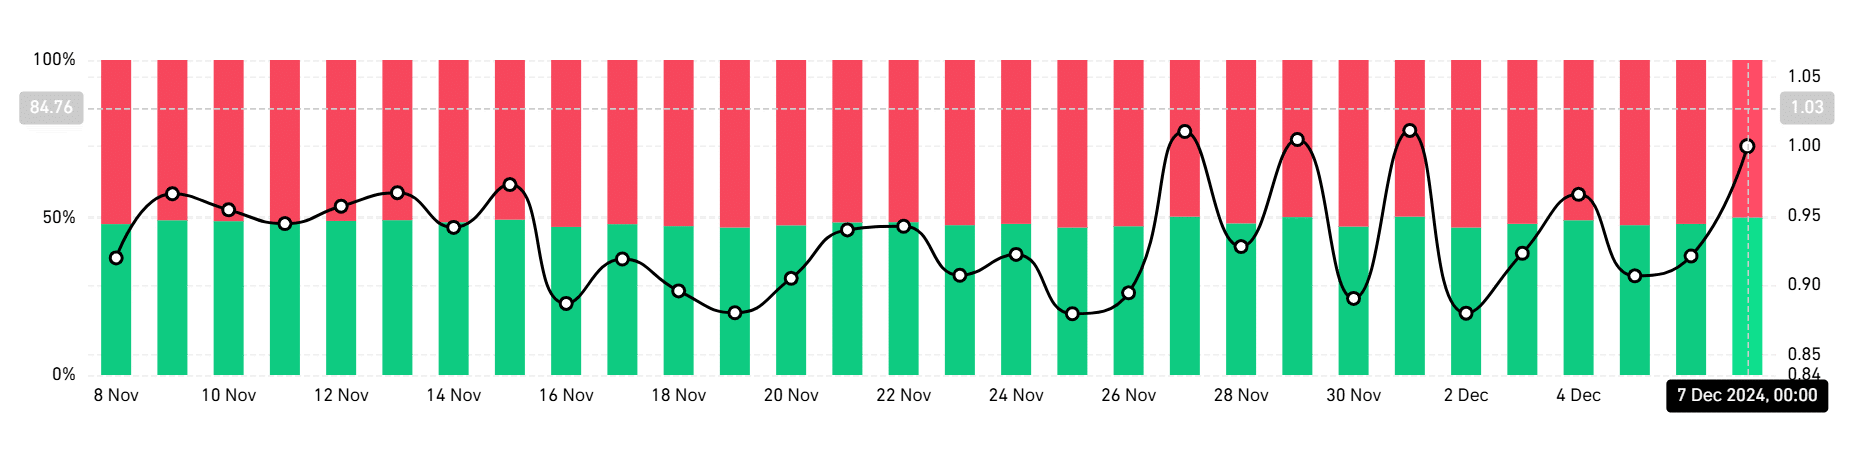
Source: Coinglass
Open Interest and its implications
Analysis also showed that PEPE’s OI surged to $459.71 million – A sign of greater capital inflows into derivatives trading. Although not at its ATH by any means, its press time levels were higher than what could be seen in the months prior.
Such a trend often correlates with rising volatility as market participants position for potential price swings. High OI and unstable funding rates create a precarious environment for over-leveraged traders, potentially leading to liquidations that could accelerate price swings.
PEPE’s price performance and technical outlook
The memecoin’s price has continued its recovery on the charts, reflecting bullish sentiment despite market volatility. In fact, the token recently reclaimed the critical $0.000002000-level and at press time, was trading above the 50-day moving average of $0.000001531. This can be interpreted as a sign of sustained upward momentum.
The Ichimoku cloud also offered additional support near $0.000001913 – Reinforcing a bullish setup in the short term.
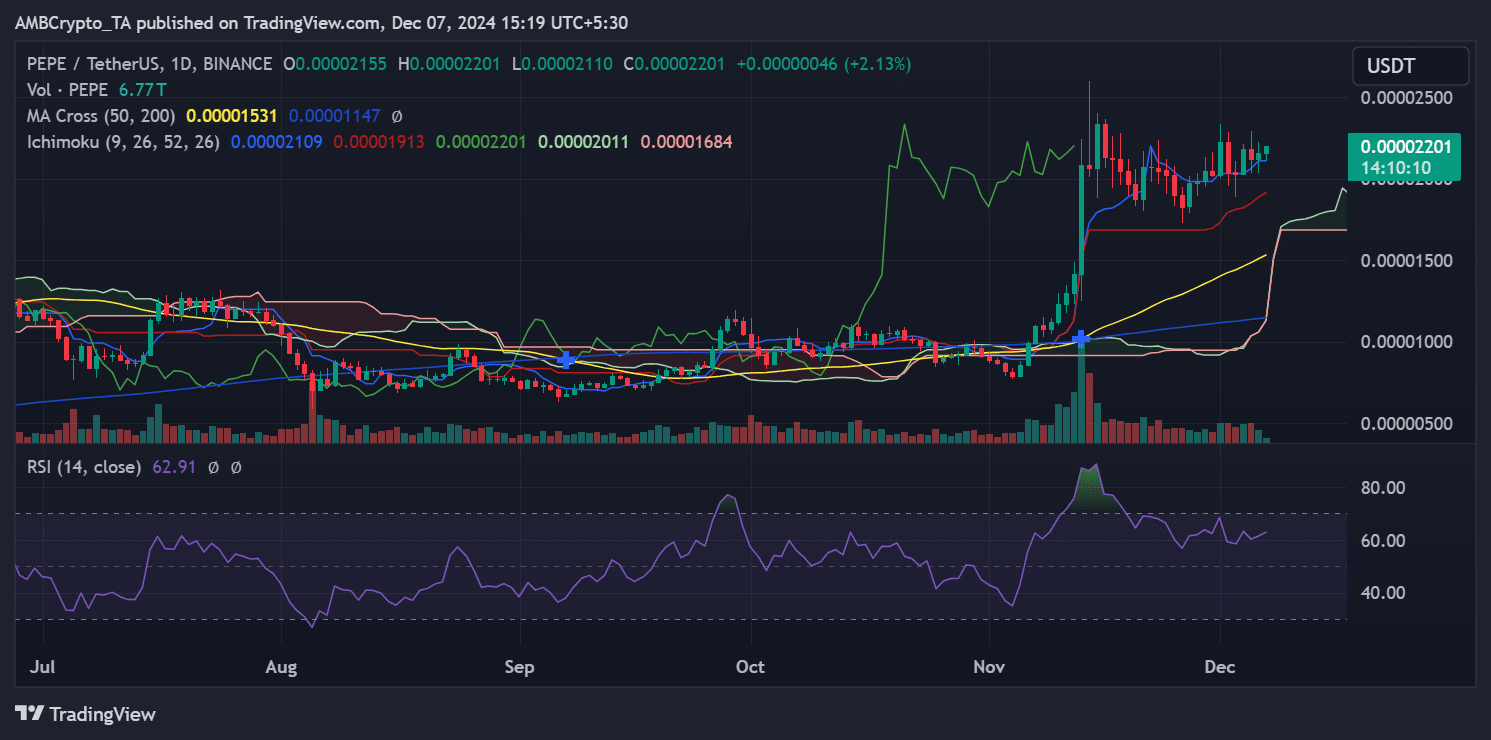
Source: TradingView
However, the RSI at 62.91 hinted that PEPE could be approaching overbought territory, warranting caution. If the price holds above the Ichimoku support and funding rates stabilize, the memecoin could aim for the $0.000002500 resistance zone.
Conversely, failing to maintain its press time levels could result in a pullback towards the $0.000001800 zone, aligning with broader market corrections.
– Is your portfolio green? Check out the Pepe Profit Calculator
The memecoin’s market activity underlined a tug-of-war between speculative positions, as evidenced by sharp funding rate swings and a balanced Long/Short Ratio. The rise in the OI and steady price recovery pointed to higher confidence among confidence, but also heightened risk.
Whether PEPE sustains its upward trajectory or succumbs to a correction will depend on how these metrics evolve in the days ahead.