
- ai16z saw strong short-term bullish sentiment during the rally to $0.175, which was quickly reversed.
- The CMF indicator showed which way traders should expect the price to swing next.
AI agent token ai16Z [AI16Z] saw strong short-term bullish sentiment. After the pullback to $0.134 on the 1st of July, the token has rebounded strongly.
It rallied 30% in under four days, reaching a local high of $0.175, before volatility kicked in again.
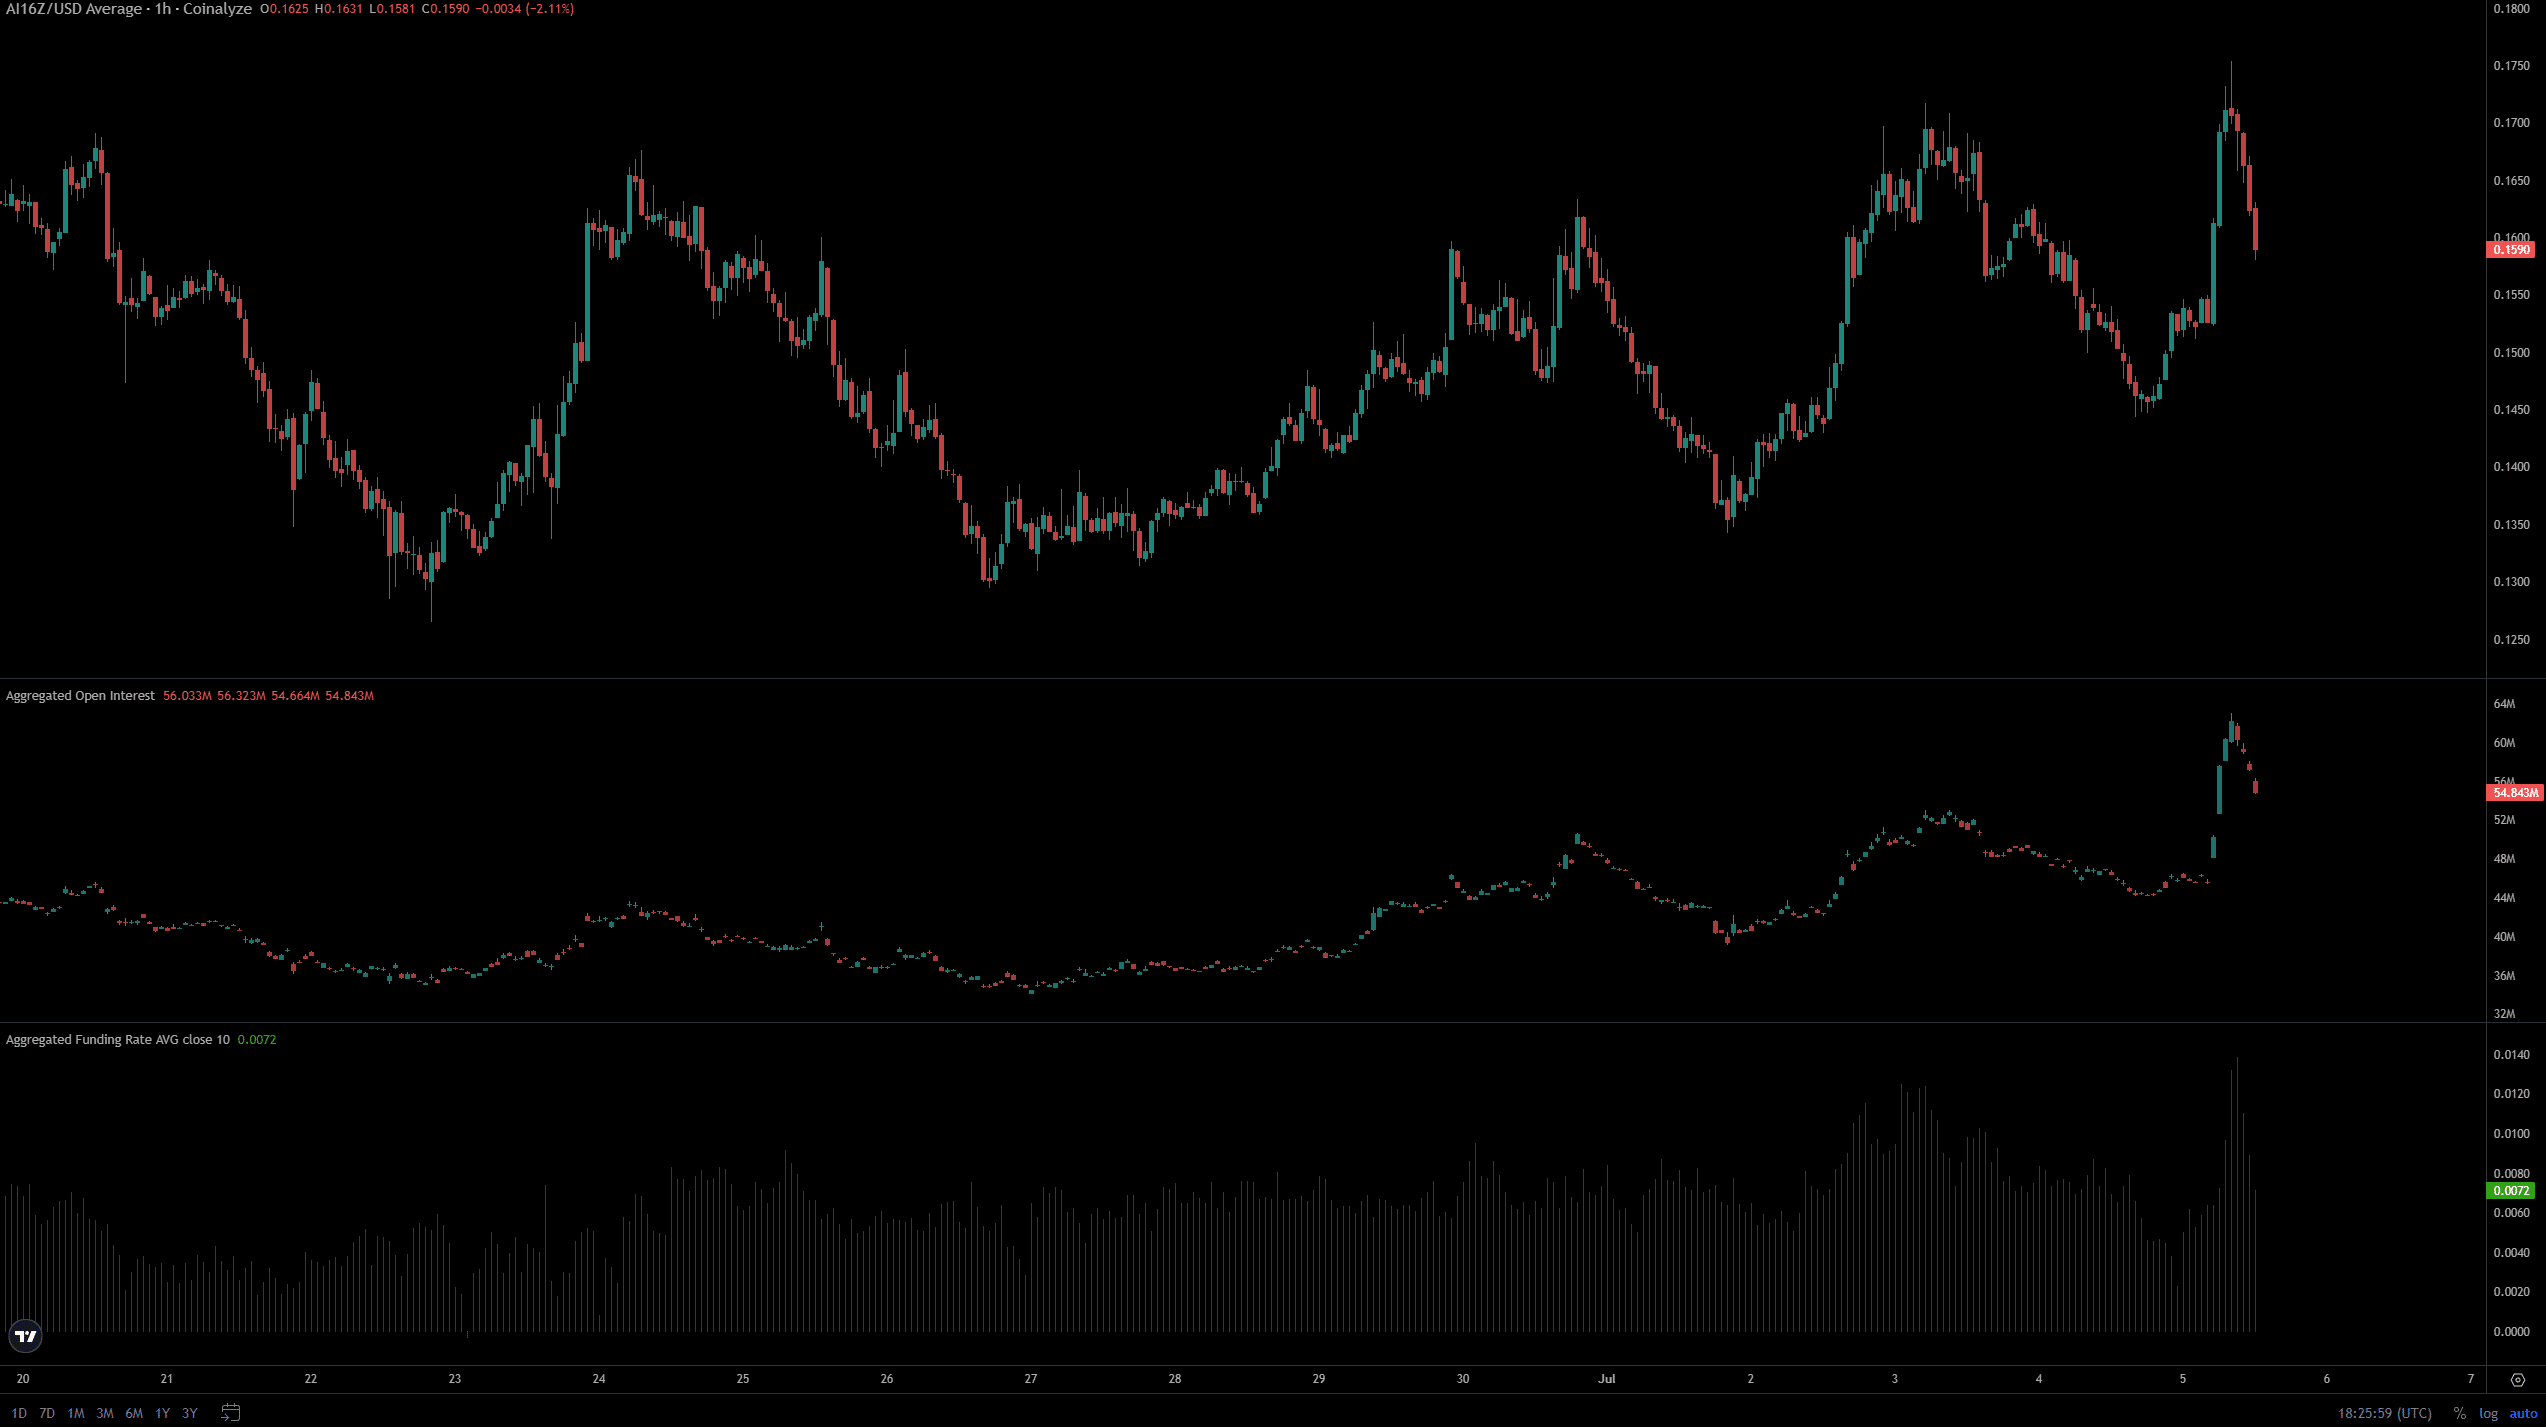
Source: Coinalyze
The AI agent token saw a remarkable uptick in Open Interest, with an 18.2% increase within the past 24 hours. Accounting for the swift pullback from $0.175, AI16Z was only up 2.05% within the past day.
The high OI and positive funding rate pointed toward intense short-term bullish sentiment.
This sentiment could have worked against the bulls, as the liquidity around the $0.175 resistance was swept before a bearish reversal.
AMBCrypto examined whether the altcoin’s bulls could make another breakout attempt soon.
Is AI16Z rallying or consolidating?
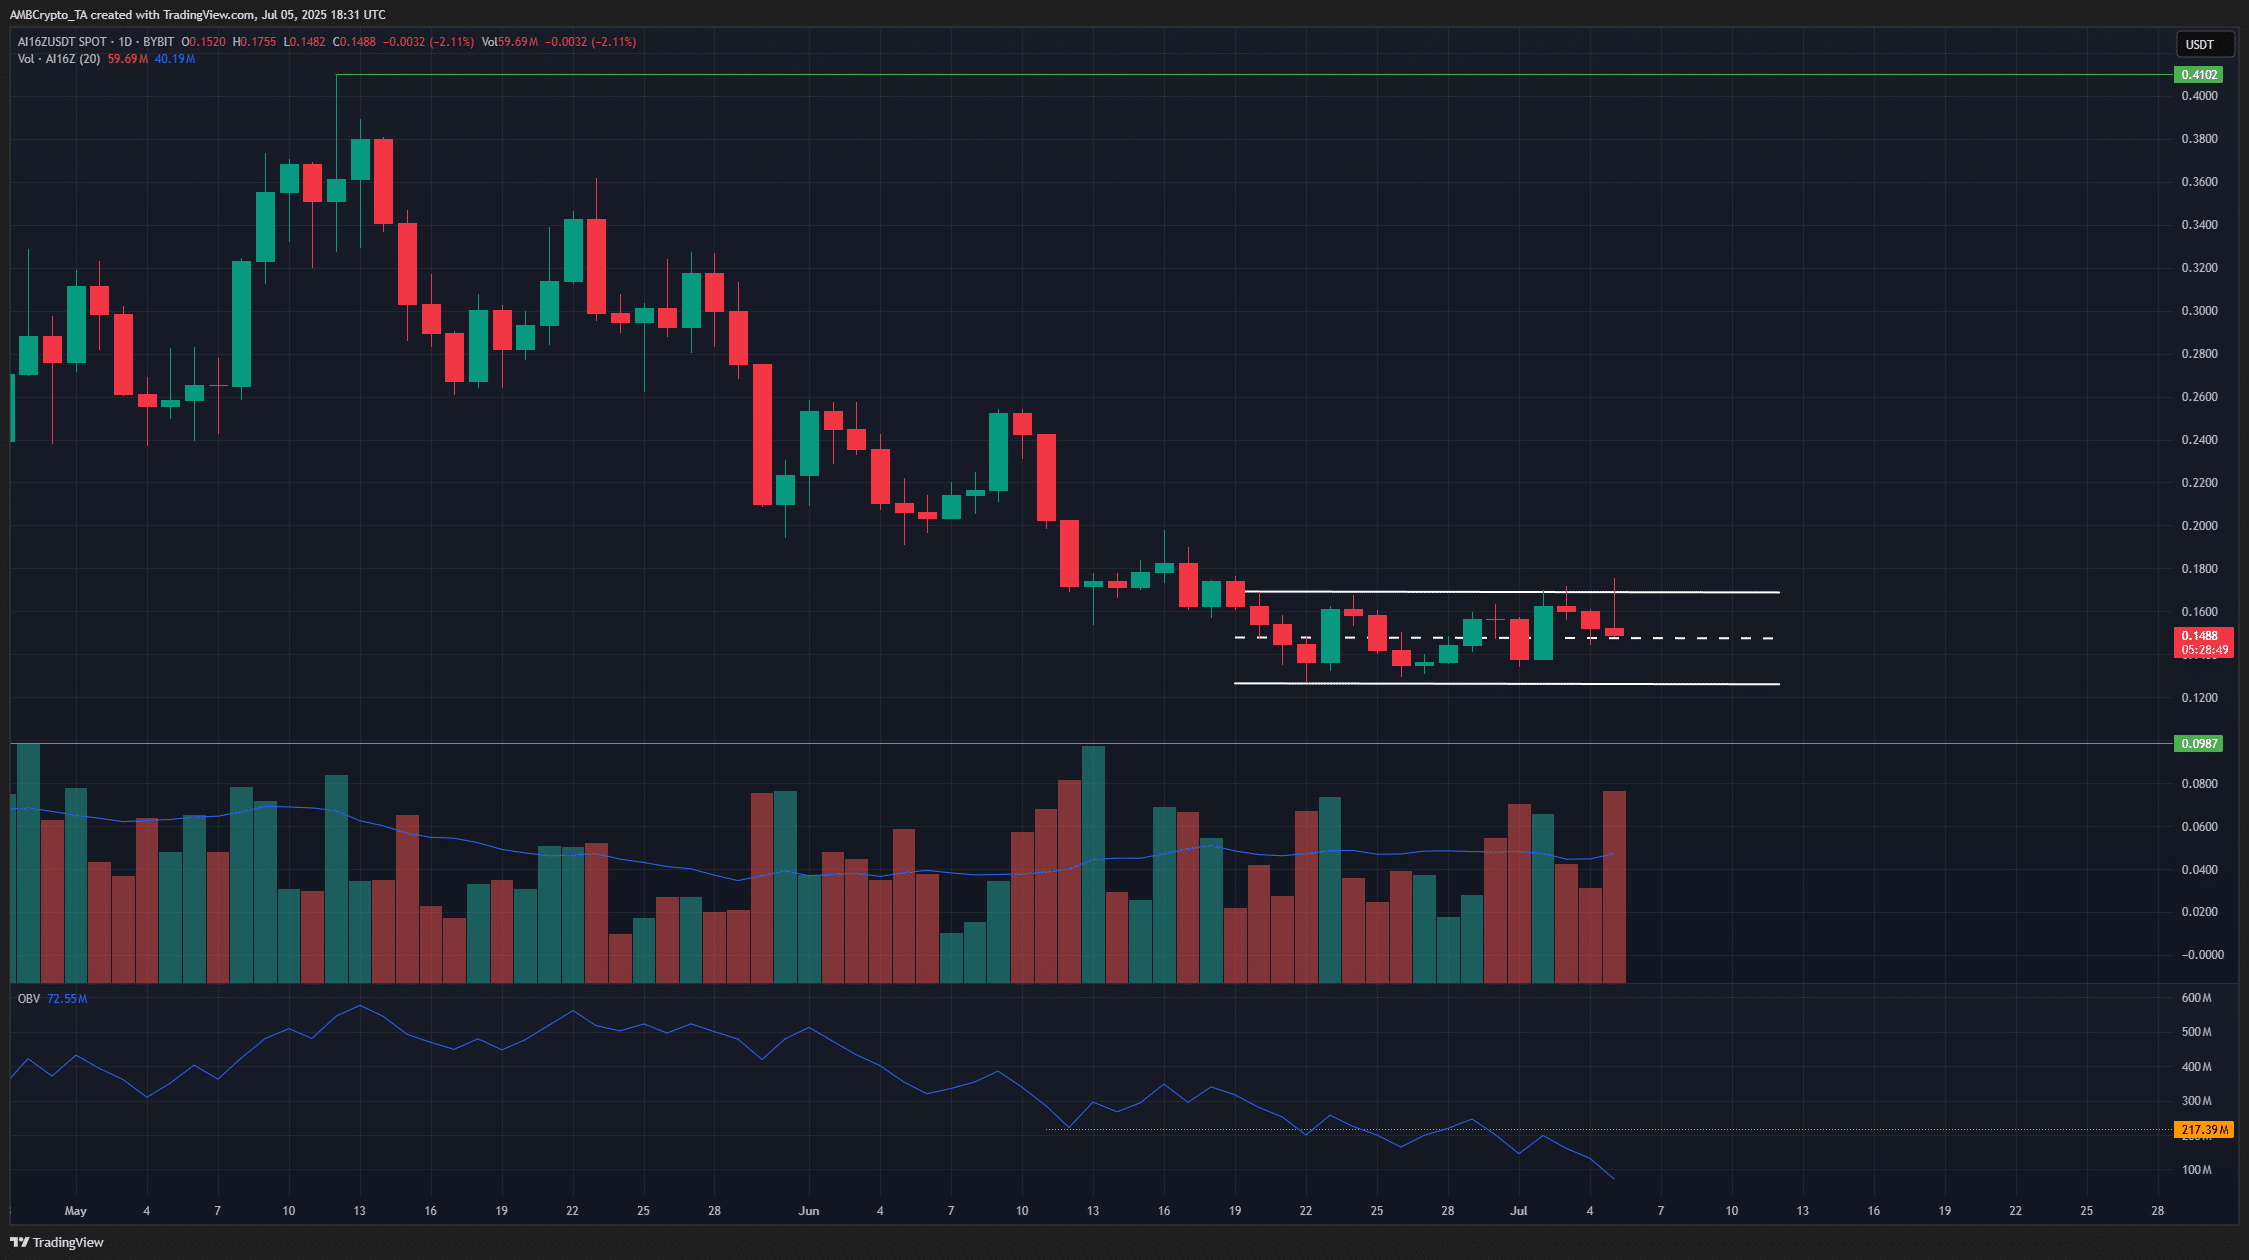
Source: AI16Z/USDT on TradingView
The 1-day chart showed that the trend of AI16Z had been bearish since May. Over the past two weeks, the token has ranged between the $0.126 and $0.169 levels, with the mid-range level at $0.147.
The trading volume has been higher over the past month than it was during the final week of May, when the retracement from $0.34 began.
This suggests that the selling pressure, which had been hesitant in late May, has taken over the AI16Z market over the past month. The OBV agreed with this idea, forming new lower lows, a sign of dominant selling volume.
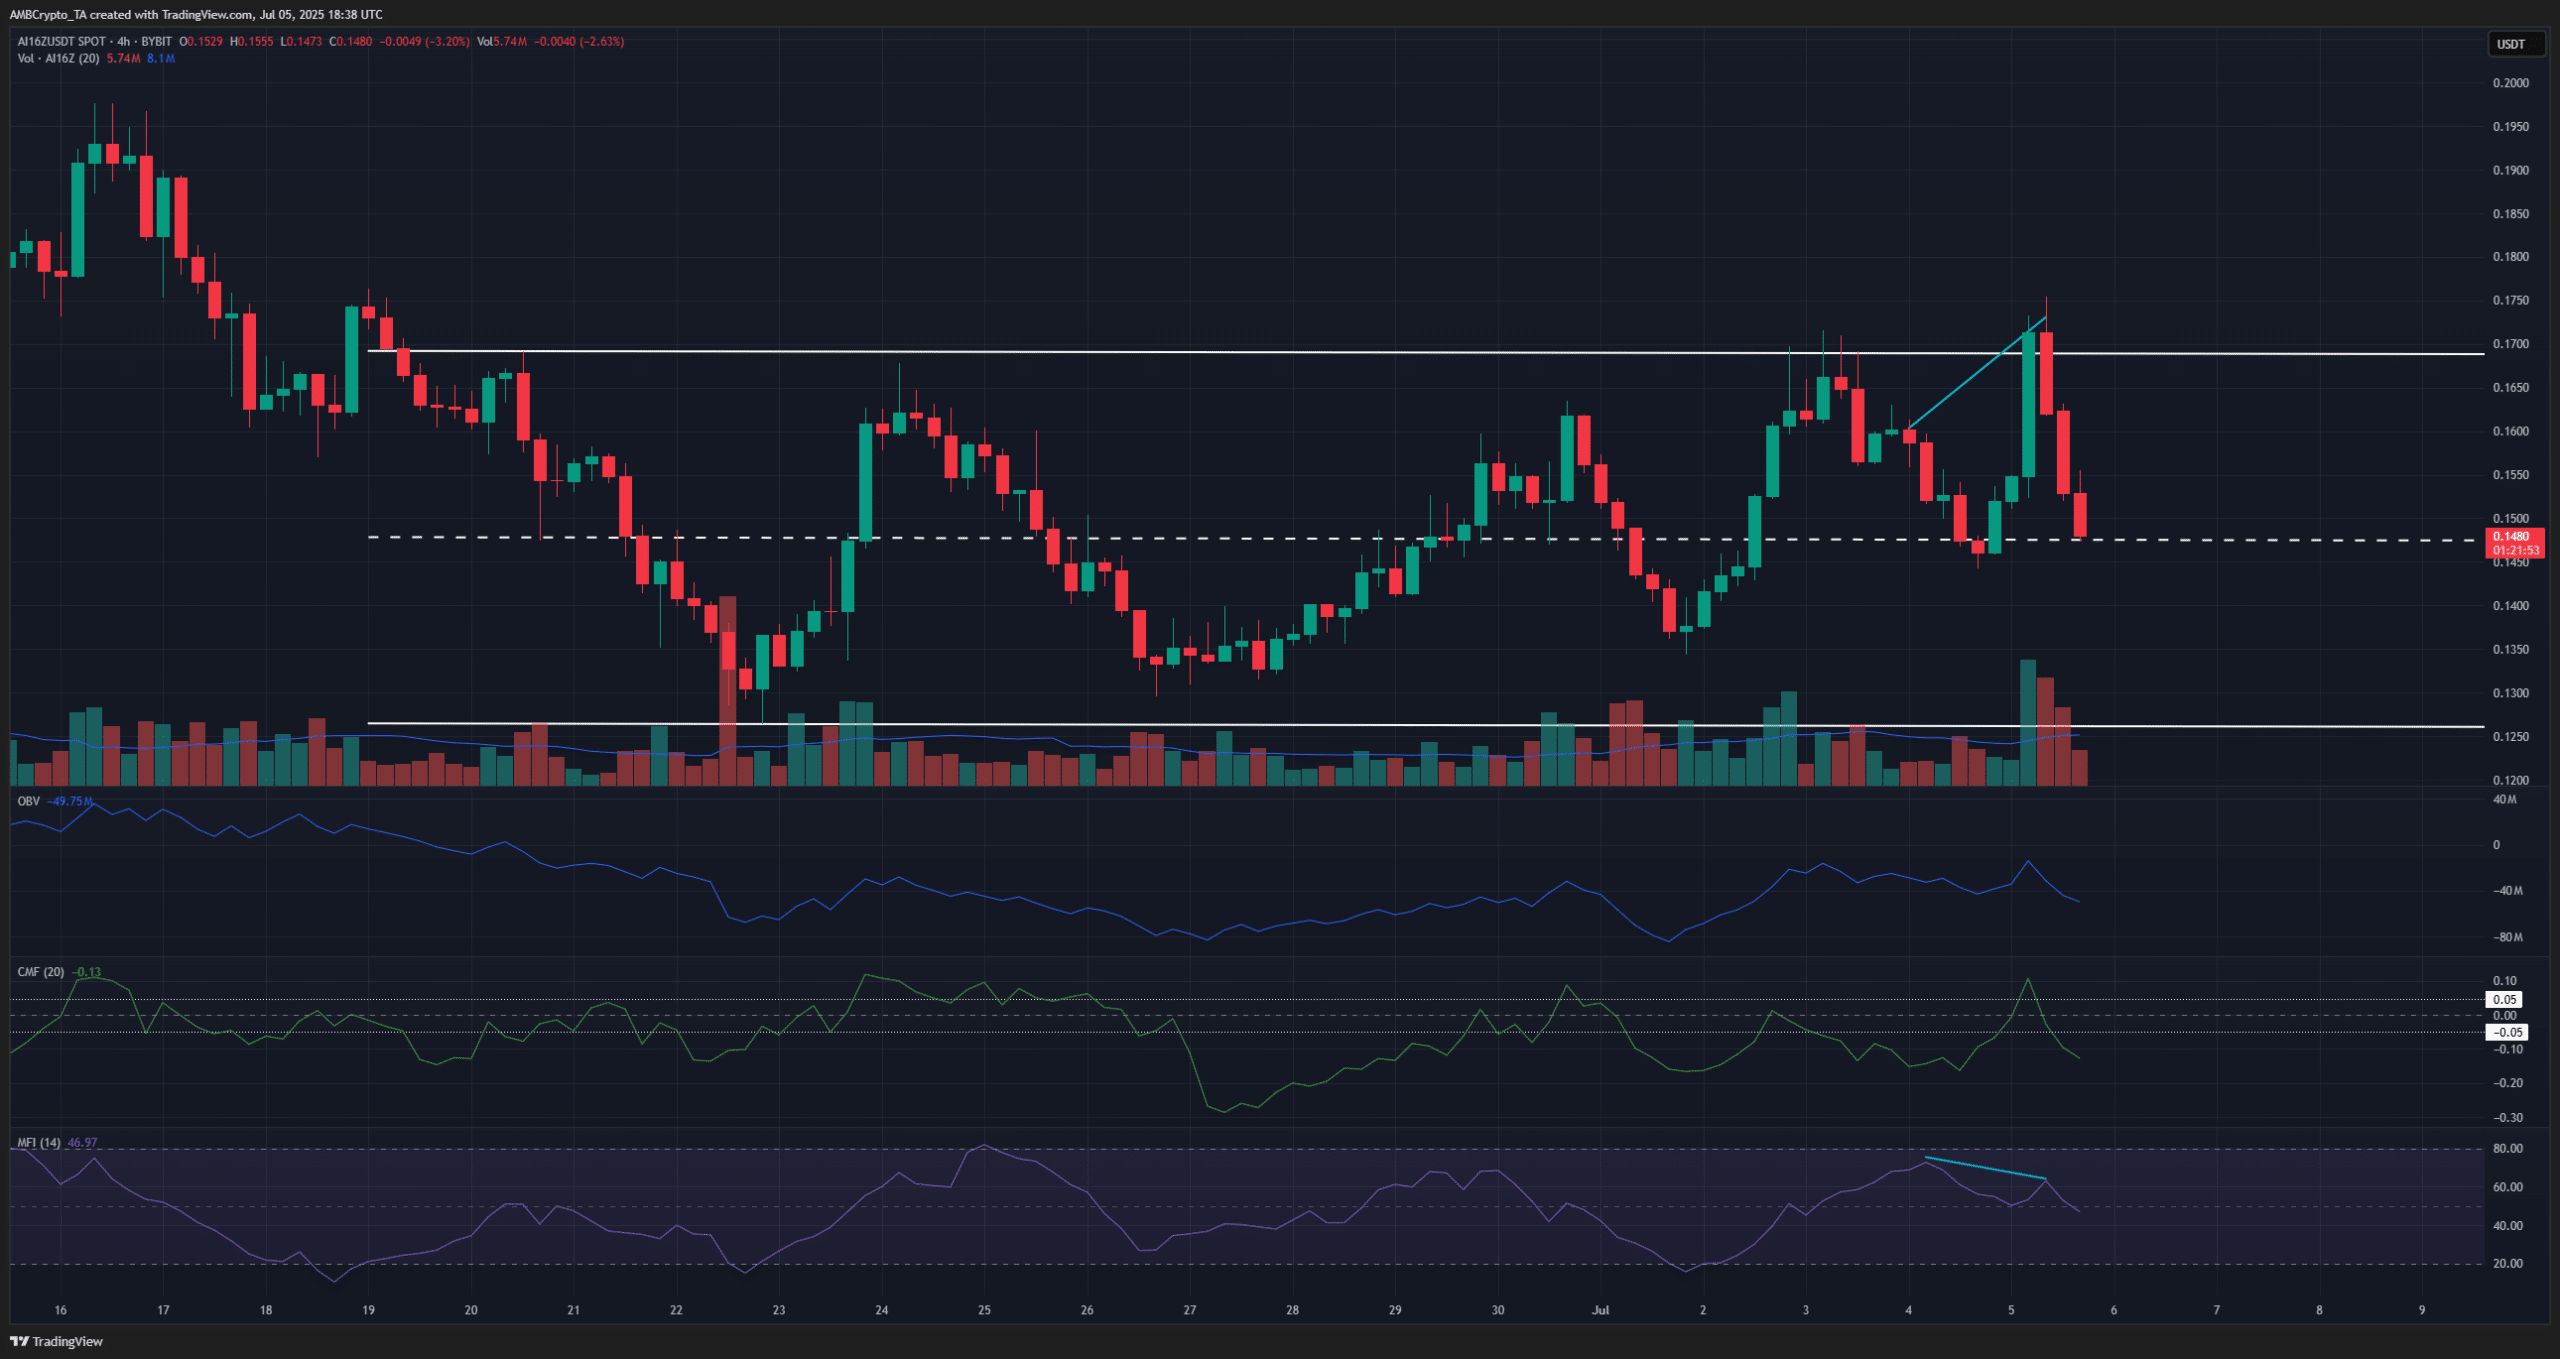
Source: AI16Z/USDT on TradingView
The 4-hour chart saw a bearish divergence between the MFI and the price, followed by a wicked rejection at the range highs. At the time of writing, the price was at the mid-range support.
Inability to defend this level would mean that swing traders can prepare for a drop toward $0.135, or as deep as $0.126.
While the OBV appeared to trend higher over the past week, the CMF has been below -0.05 for the majority of the past week.
The CMF was a more nuanced volume indicator because of how it weighs the volume based on where the price closes within the day’s trading range.
The +0.05 and -0.05 also filter out bad signals, making the CMF’s findings more reliable.
The CMF showed that sellers have had the upper hand, while the ai16z token traded within a range. Therefore, AI16Z was neither rallying nor consolidating.
The consistent selling pressure meant that distribution was underway, and investors should beware.
Disclaimer: The information presented does not constitute financial, investment, trading, or other types of advice and is solely the writer’s opinion