
Recent technical analysis has revealed that the XRP price is consolidating after breaking key resistance levels to new highs. A crypto analyst has warned of an impending XRP price crash, urging investors not to get distracted as the RSI is still significantly above 50%. Discussing his predictions through short and long-term XRP price charts, the analyst shows that the cryptocurrency is firmly positioned in a bullish trend despite impending corrections.
XRP Price RSI Hints At Potential Crash
On the 4-hour XRP chart, a double tap structure is highlighted in the Relative Strength Index (RSI), a technical indicator used to measure the momentum of a cryptocurrency. This double tap pattern typically signals further downward movement before a price stabilization.
Related Reading
According to Dark Defender, a crypto analyst on X (formerly Twitter), the RSI’s recurrent dips into oversold territory indicate that XRP could experience a price crash to new lows. The analyst disclosed that the XRP price had previously found strong support at $2.17; however, the cryptocurrency experienced a bounce to the upside.
After hitting this support level, the XRP price is now consolidating, a pattern often associated with a potential uptrend after a correction. Despite the slight market recovery, the analyst has warned of another impending price crash in this same support zone as the RSI approaches oversold levels once more.
Earlier in December, the RSI had hit oversold territories after dipping below 30%. Now XRP’s RSI is above 50% and signaling a potential to experience a price correction between the support levels at $2.17 and $2.18. Dark Defender has revealed that this price crash could occur soon as XRP is expected to enter oversold territory within a day.
Despite this potential price correction, the analyst has acknowledged that the XRP’s broader outlook still looks bullish, with an uptrend continuation expected once the market consolidates following its projected price dip to new lows. Dark Defender has also predicted that XRP’s next price target after this projected correction is likely above $3, marking an almost 40% increase from the $2.17 support area.
XRP 3-Month Chart Signals Strong Bullish Set Up
Following his predictions that the XRP price could crash as it enters oversold conditions, Dark Defender also shared a 3-month chart analysis, painting a brighter outlook for the cryptocurrency. The chart shows that XRP has recently broken through a multi-year resistance level for the first time in over five years, signaling a strong bullish shift.
Related Reading
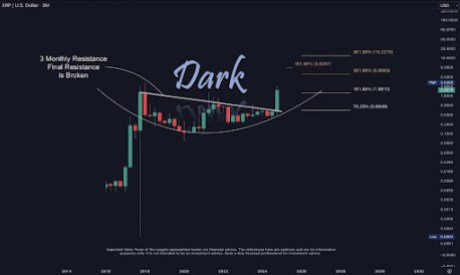
The three-month green candle structure between October and December confirms strong buying pressure, setting the stage for a potentially bullish Q1 2025 from January to March. A rounded bottom pattern can also be seen on the XRP 3-month chart. This pattern is a classic bullish reversal structure that indicates a gradual move from a downtrend to an uptrend.
Dark Defender has marked several Fibonacci levels as potential price targets for XRP. According to the analyst, XRP could see a 261.80% rise to the 5.8563 Fibonacci level between $5 to $9. After which, the analyst expects a 361.80% surge to the 18.2275 Fibonacci between $16 to $28. Support levels at the 0.6649 Fibonacci at $0.9 have also been highlighted, acting as a safety net for XRP during price corrections.

Featured image created with Dall.E, chart from Tradingview.com