
- Bullish structure break on the 1-day timeframe seemed to be an important development
- FLOKI’s 4-hour chart outlined a buying opportunity
FLOKI had been on a downtrend in June, shedding 12.4% of its value in a month. In fact, it saw an attempted rally in the second week of the month, and an attempted breakdown beneath the crucial support at $0.0000745.
Over the past week, however, this level was reclaimed as support, and FLOKI bulls are now making another attempt towards $0.0001.
This psychological round-number resistance was nearly tested as resistance in June, marking the previous month’s high. It might be the next price target for FLOKI, but it’s still unclear whether there may be enough demand from buyers to drive the price higher.
Bitcoin’s [BTC] volatility around its all-time high did not help either.
Bullish structure break for FLOKI gives a promising start to July
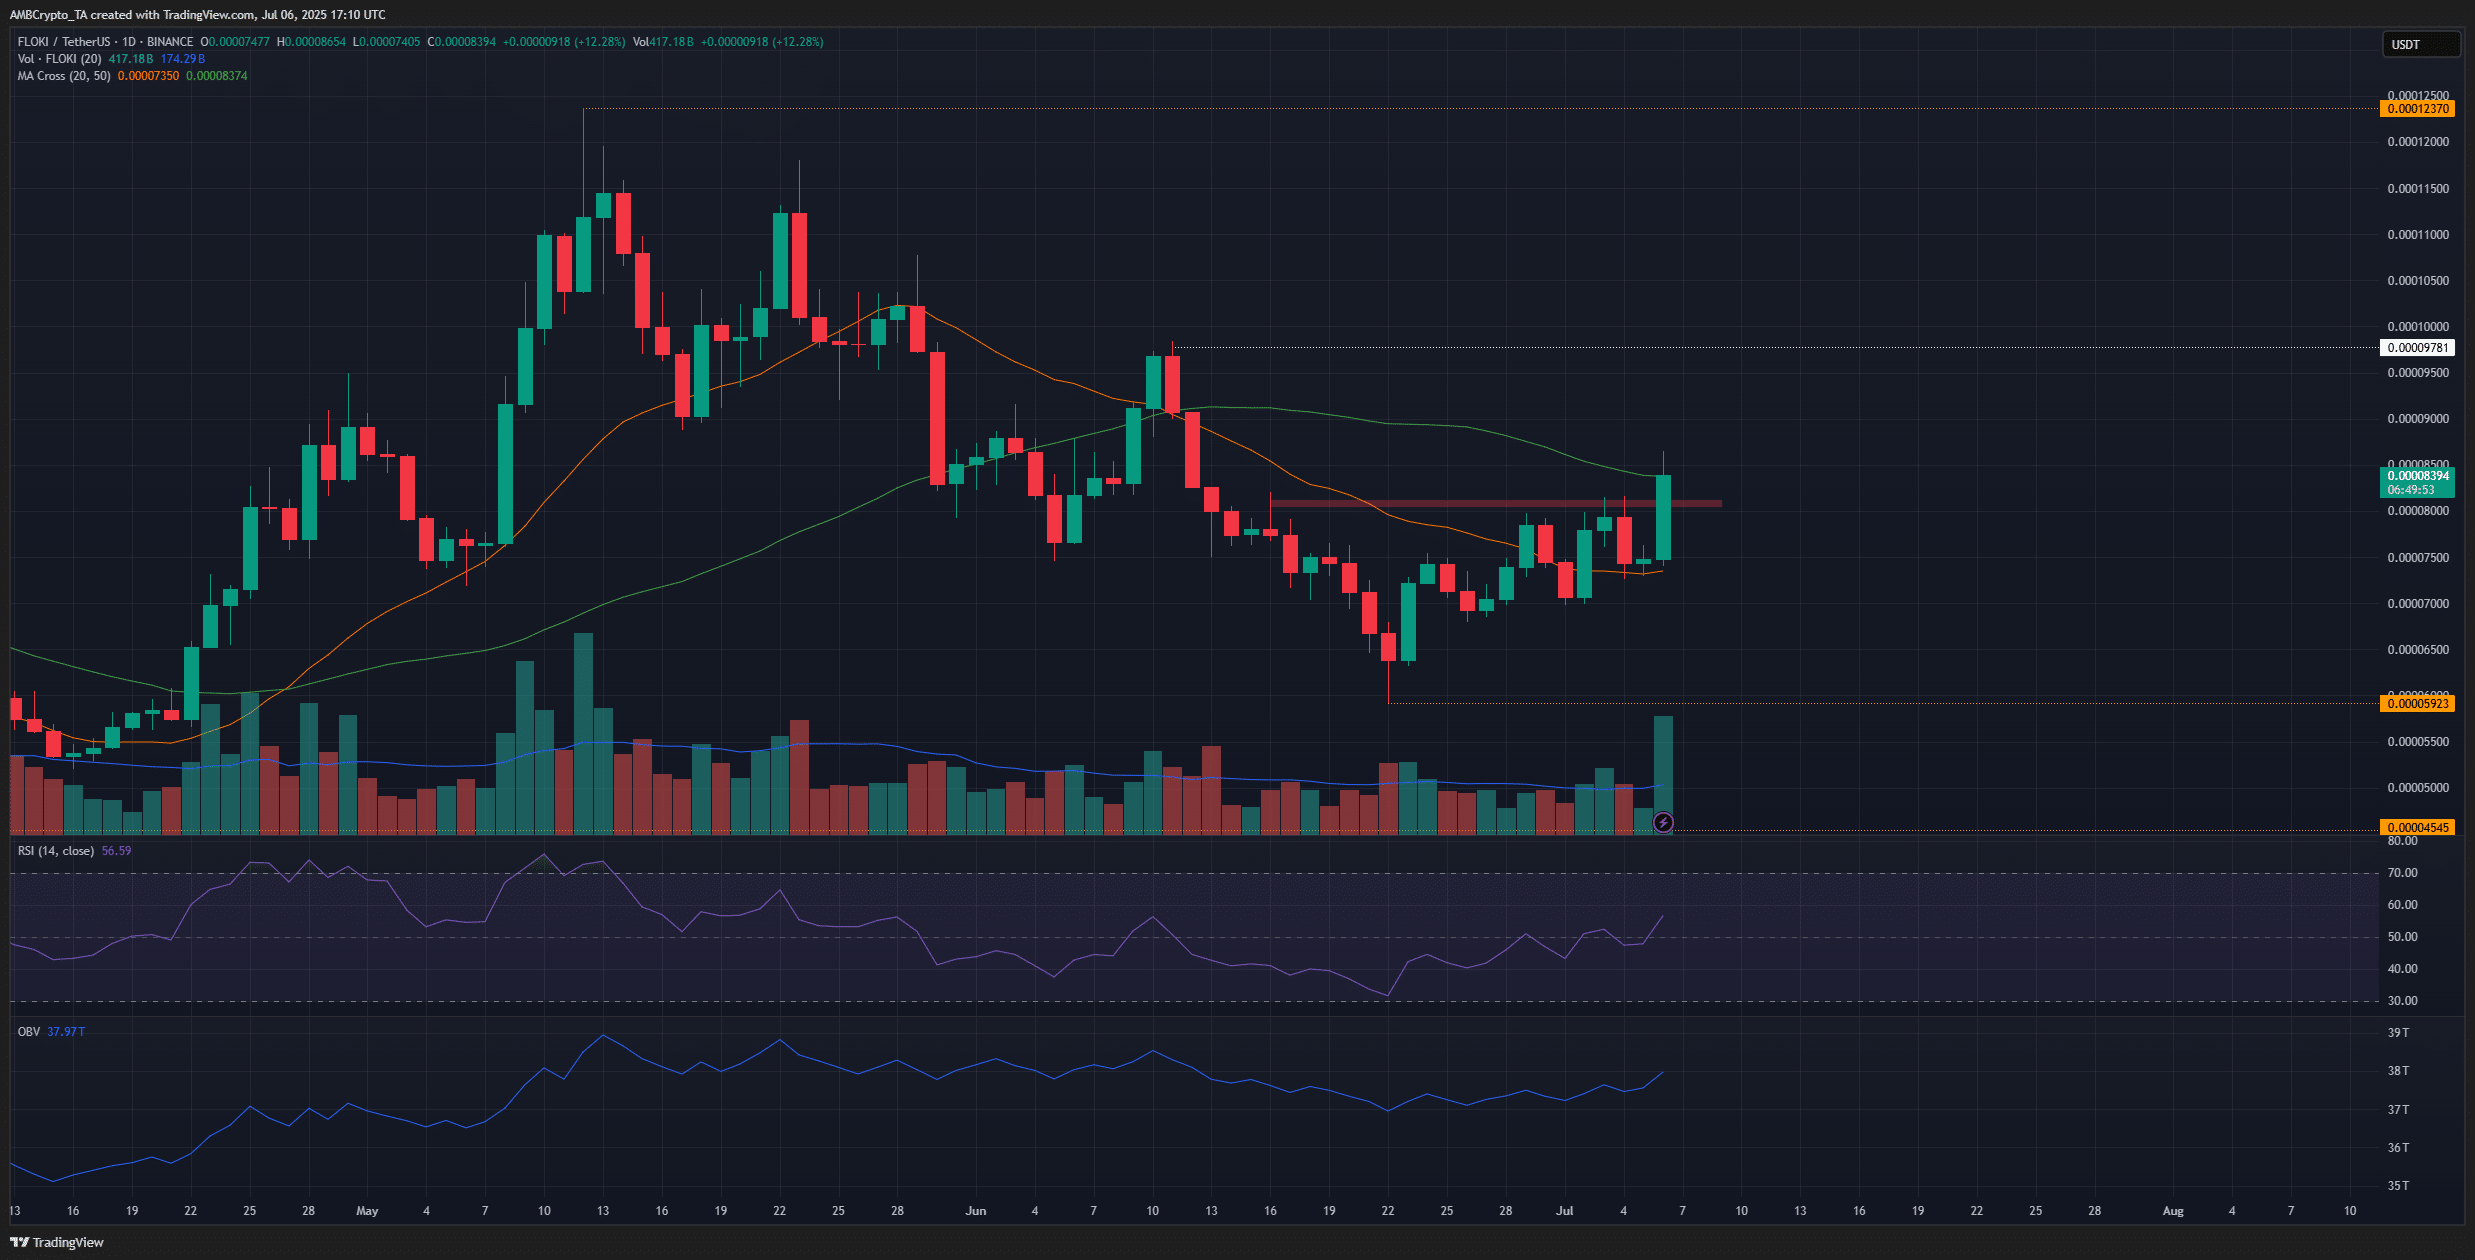
Source: FLOKI/USDT on TradingView
On 29 June, FLOKI rose past the previous daily lower high at $0.0000754, thereby making a bullish market structure break. This was followed by higher lows and a higher high, keeping the bullish structure intact.
At the time of writing, although the moving averages highlighted bearish momentum, the price was above the 50 DMA.
At the same time, the RSI also fought its way back above the neutral 50-mark. This gave some glimmer of hope to investors that July could be bullish for the popular memecoin.
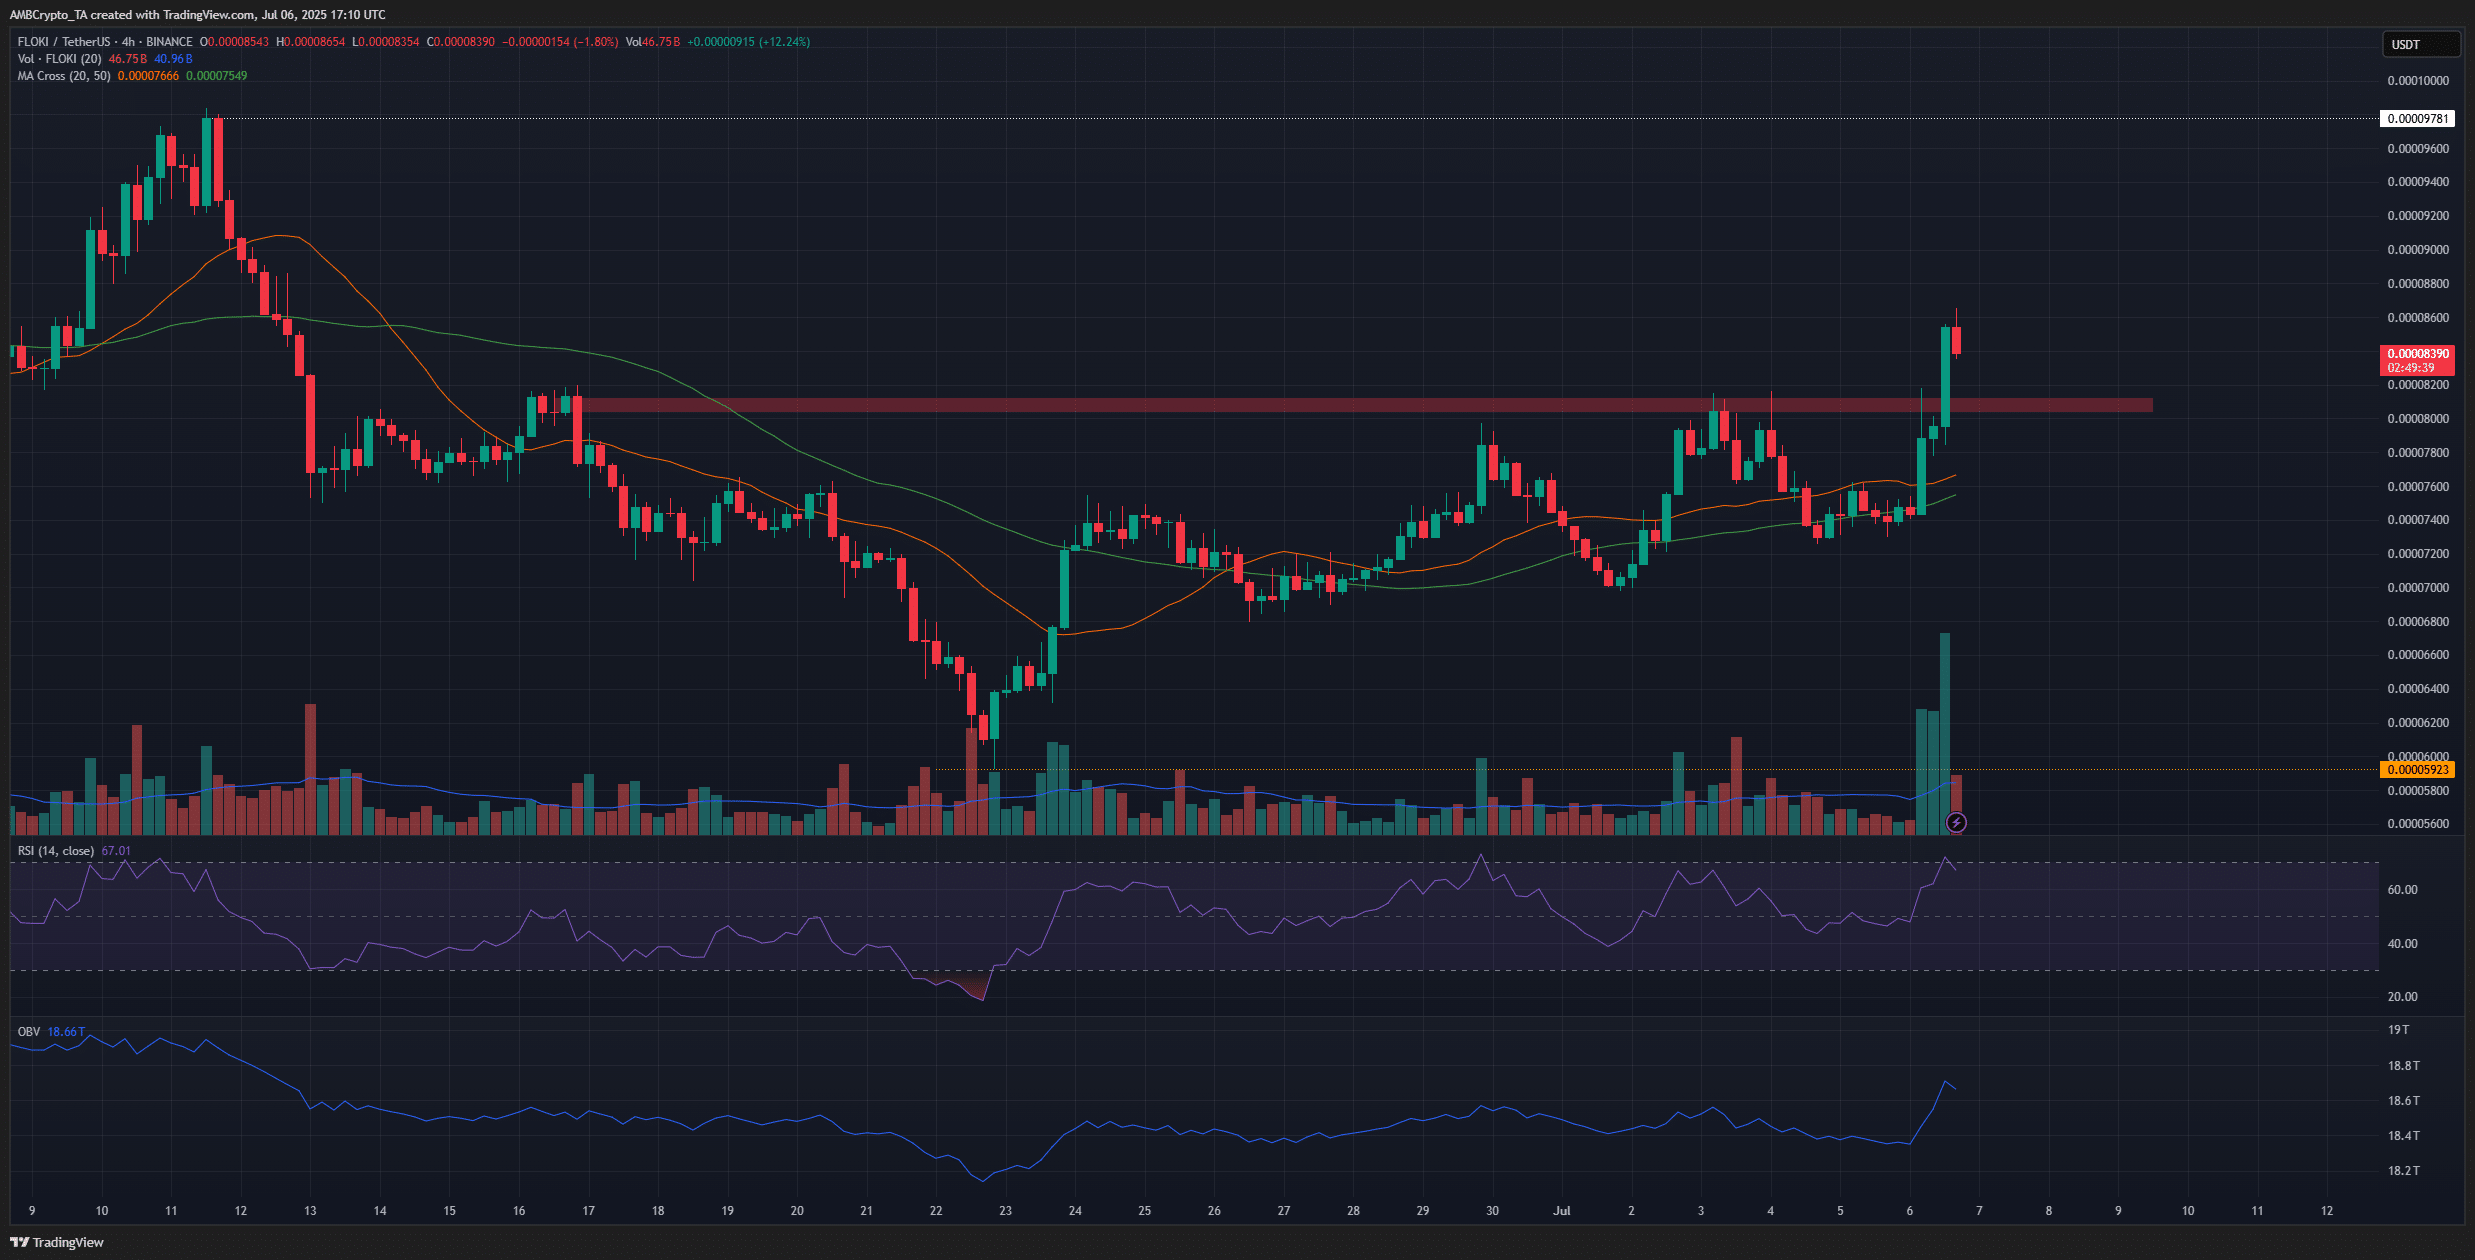
Source: FLOKI/USDT on TradingView
The bullish 1-day momentum meant that the 4-hour chart was worth investigating. AMBCrypto found that the local supply zone at $0.00008, which had rebuffed FLOKI bulls since mid-June, has since been breached. Hence, a retest of the $0.000078-$0.000082 area could present swing traders with a buying opportunity.
The next local resistance appeared to be at $0.0000987, just under the psychological resistance. Traders can seek to book profits when FLOKI’s price nears the $0.0001-level, while also waiting for further price action developments.
Disclaimer: The information presented does not constitute financial, investment, trading, or other types of advice and is solely the writer’s opinion