Close Menu
    What's Hot

    Here’s why Sonic erased $1.3 billion in value

    Whales lose SYRUP sweet tooth despite Maple Finance’s growth

    Ethereum Prepares For A Parabolic Move – ETH/BTC Chart Signals Strong Bullish Setup

    Facebook X (Twitter) Instagram
    yeek.io
    • Crypto Chart
    • Crypto Price Chart
    X (Twitter) Instagram TikTok
    Trending Topics:
    • Altcoin
    • Bitcoin
    • Blockchain
    • Crypto News
    • DeFi
    • Ethereum
    • Meme Coins
    • NFTs
    • Web 3
    yeek.io
    • Altcoin
    • Bitcoin
    • Blockchain
    • Crypto News
    • DeFi
    • Ethereum
    • Meme Coins
    • NFTs
    • Web 3
    Altcoin

    Assessing if Chainlink’s dev activity will be enough to fuel LINK’s price rally

    Yeek.ioBy Yeek.ioMarch 9, 2025No Comments3 Mins Read
    Share Facebook Twitter Pinterest Copy Link Telegram LinkedIn Tumblr Email
    Share
    Facebook Twitter LinkedIn Pinterest Email
    • Chainlink’s high development and sustained accumulation presented a bullish case for investors
    • Daily price chart hinted at bearishness, but this could change if $17.5 is breached

    Chainlink [LINK] led the DeFi sector in terms of development activity over the past month. In fact, Santiment analyst Brian noted that the pecking order in terms of volume of dev activity has not changed among the DeFi projects.

    Source: Santiment Insights

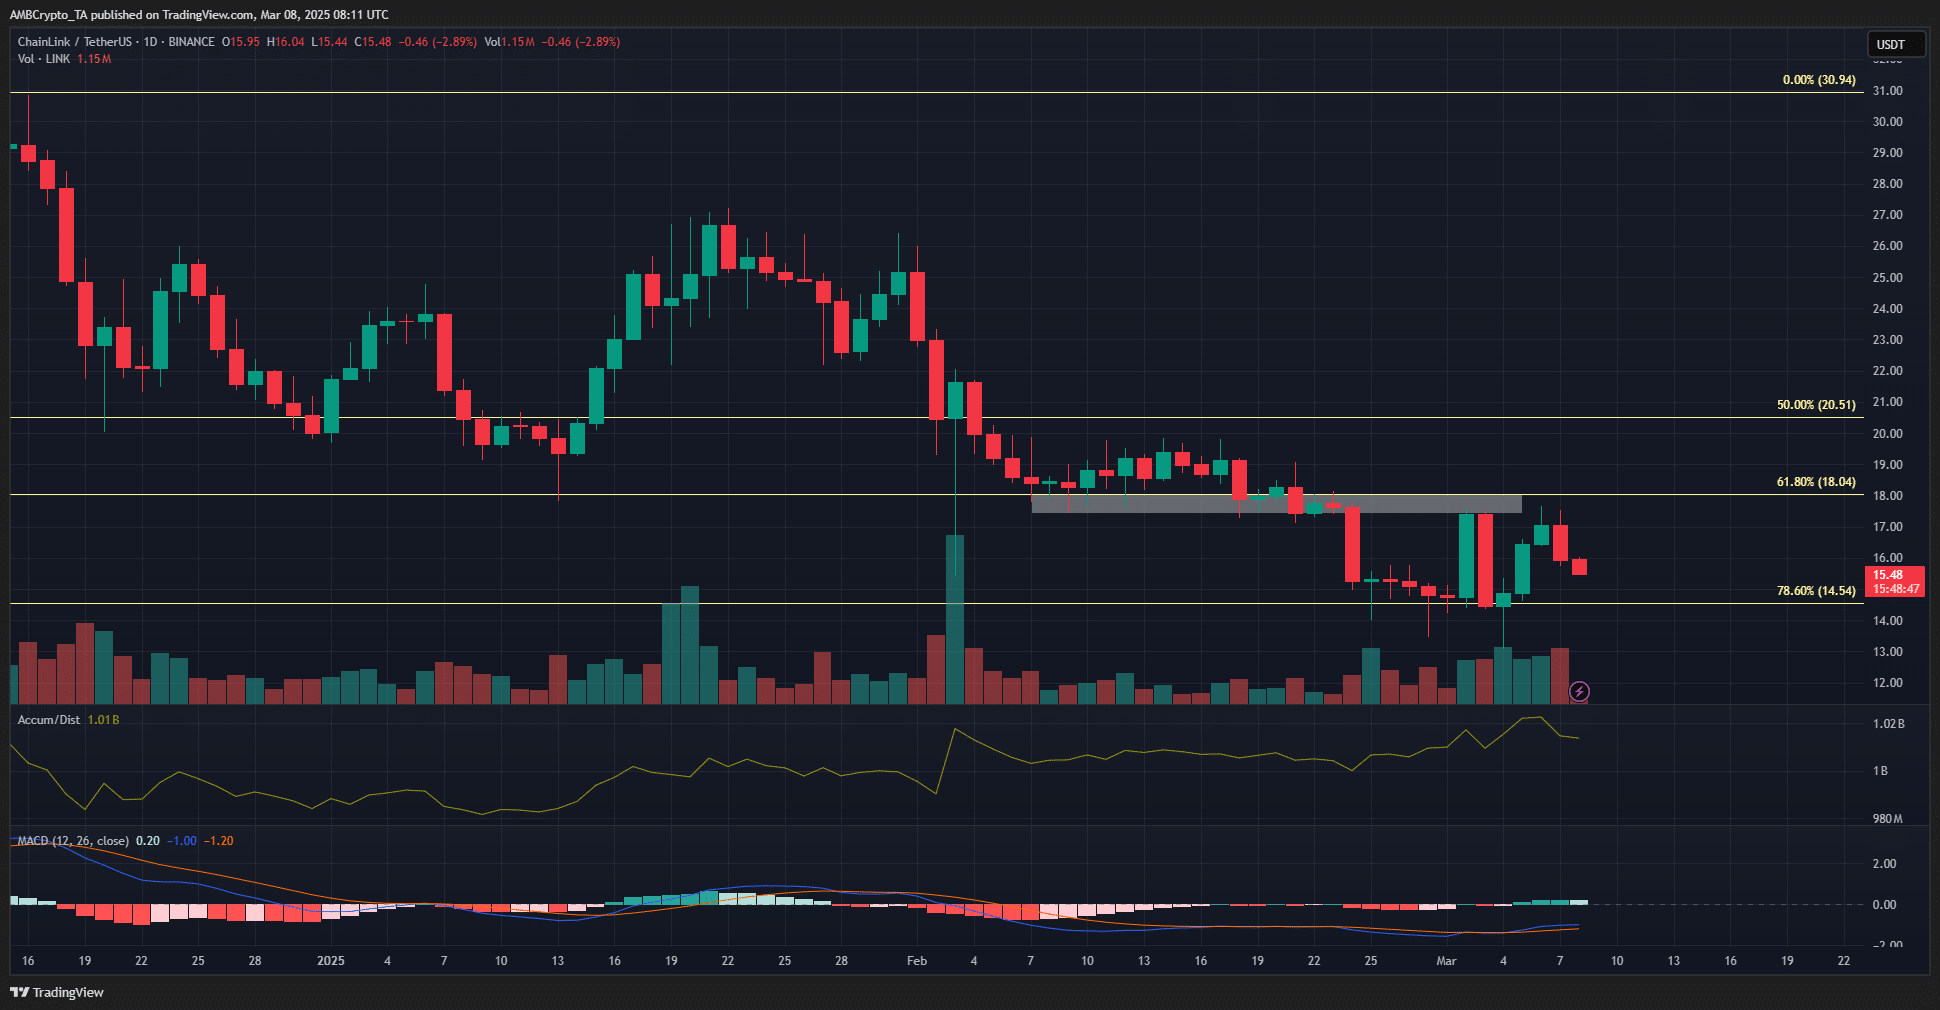
    The price action chart revealed that the bulls were able to defend the $14.4-support, but unable to surpass the $17.45-resistance level.

    This seemed to be a sign that sentiment did not favor the buyers much. Hence, the question – Do the on-chain metrics hint at a bullish reversal?

    Chainlink holders over the past three months at a sizeable loss
    LINK MetricsLINK Metrics

    Source: Santiment

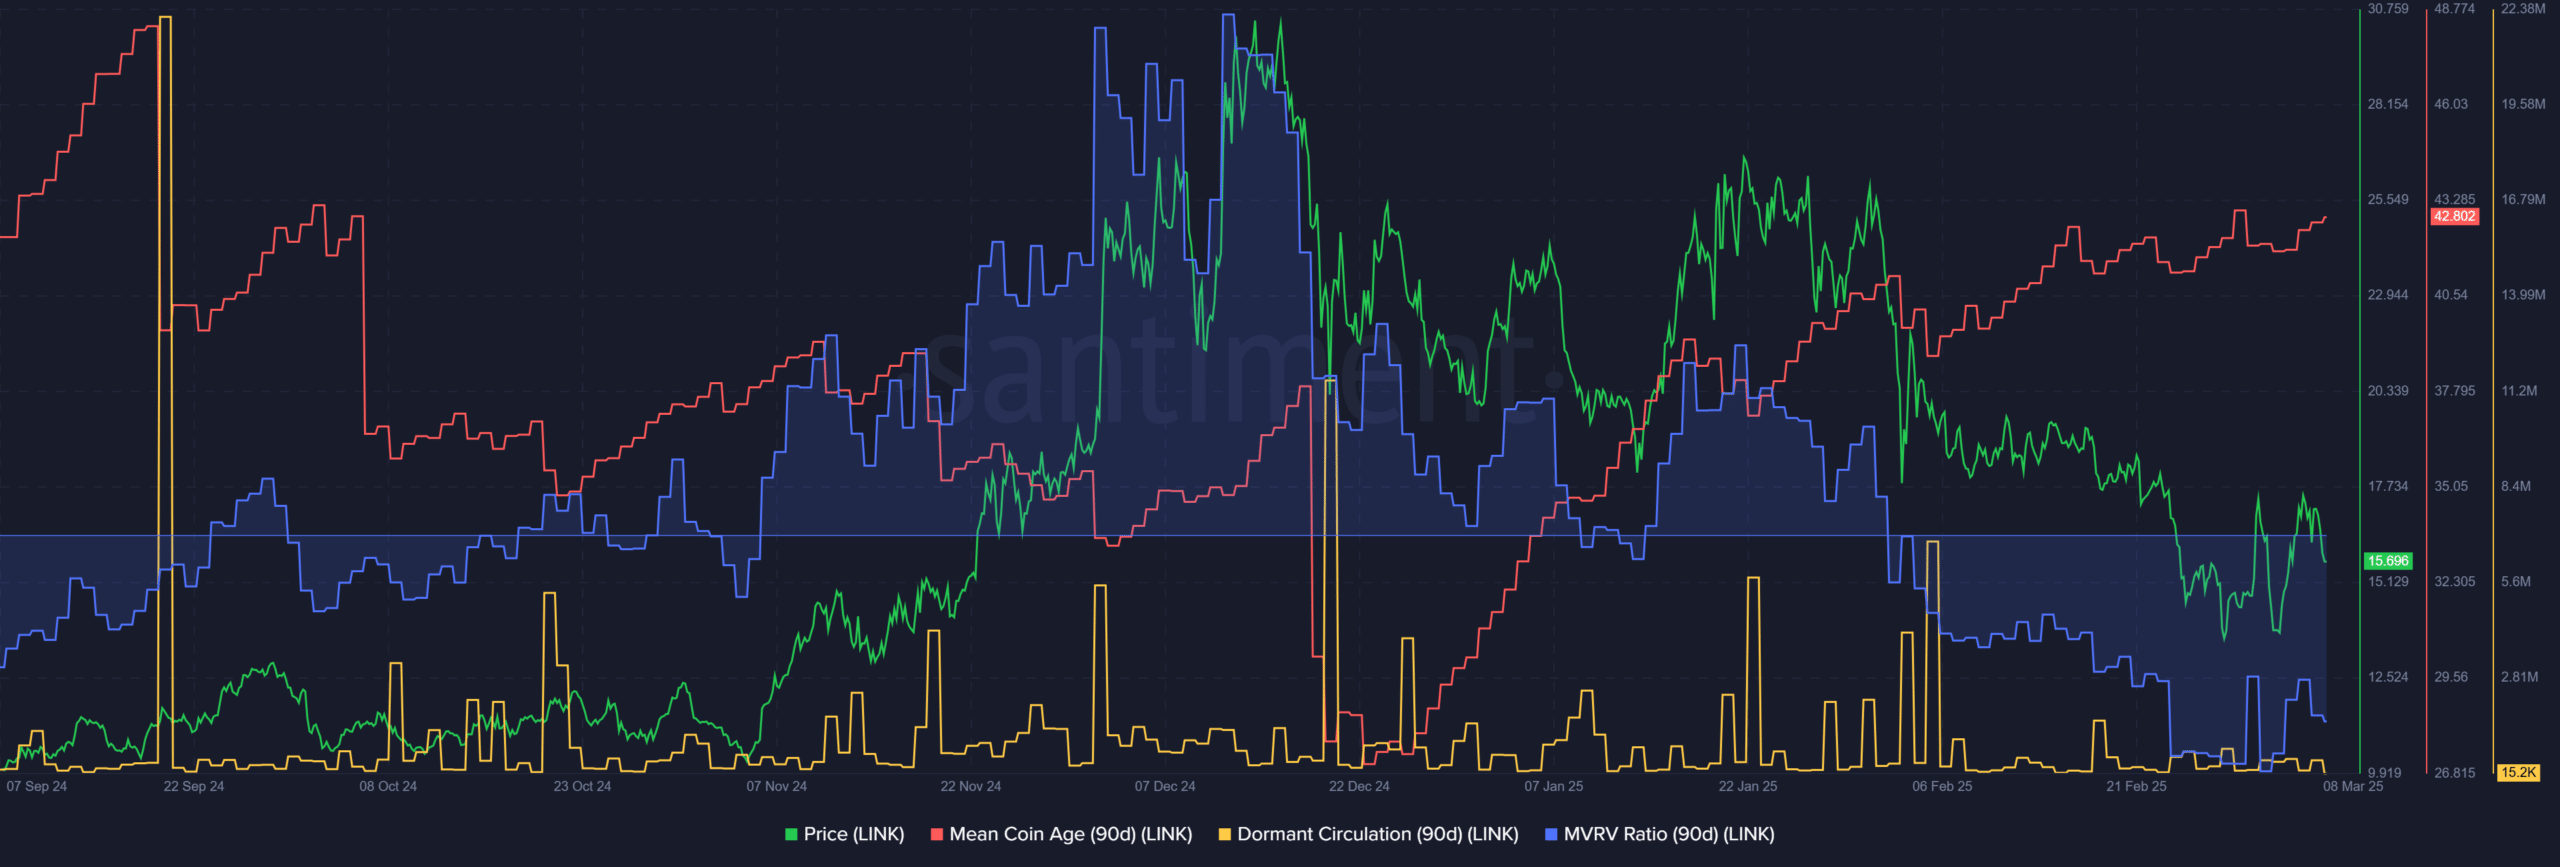
    The 90-day mean coin age saw a strong uptrend in January, but it has slowed down over the past month. It still maintained its upward trajectory. Here, the MCA metric measures the average number of days that LINK tokens stayed within their current wallets.

    A rising trope indicated accumulation across the network. This can also be seen as a bullish signal for Chainlink. Meanwhile, its MVRV ratio was at -26.29%, showing that holders within the past three months were down 27% on average.

    Combined with the rising MCA, it gave a buy signal for the token. The dormant circulation has been quiet in recent weeks, showing no spikes in token transfers which could point to selling pressure.
    Chainlink Supply DistributionChainlink Supply Distribution

    Source: Santiment

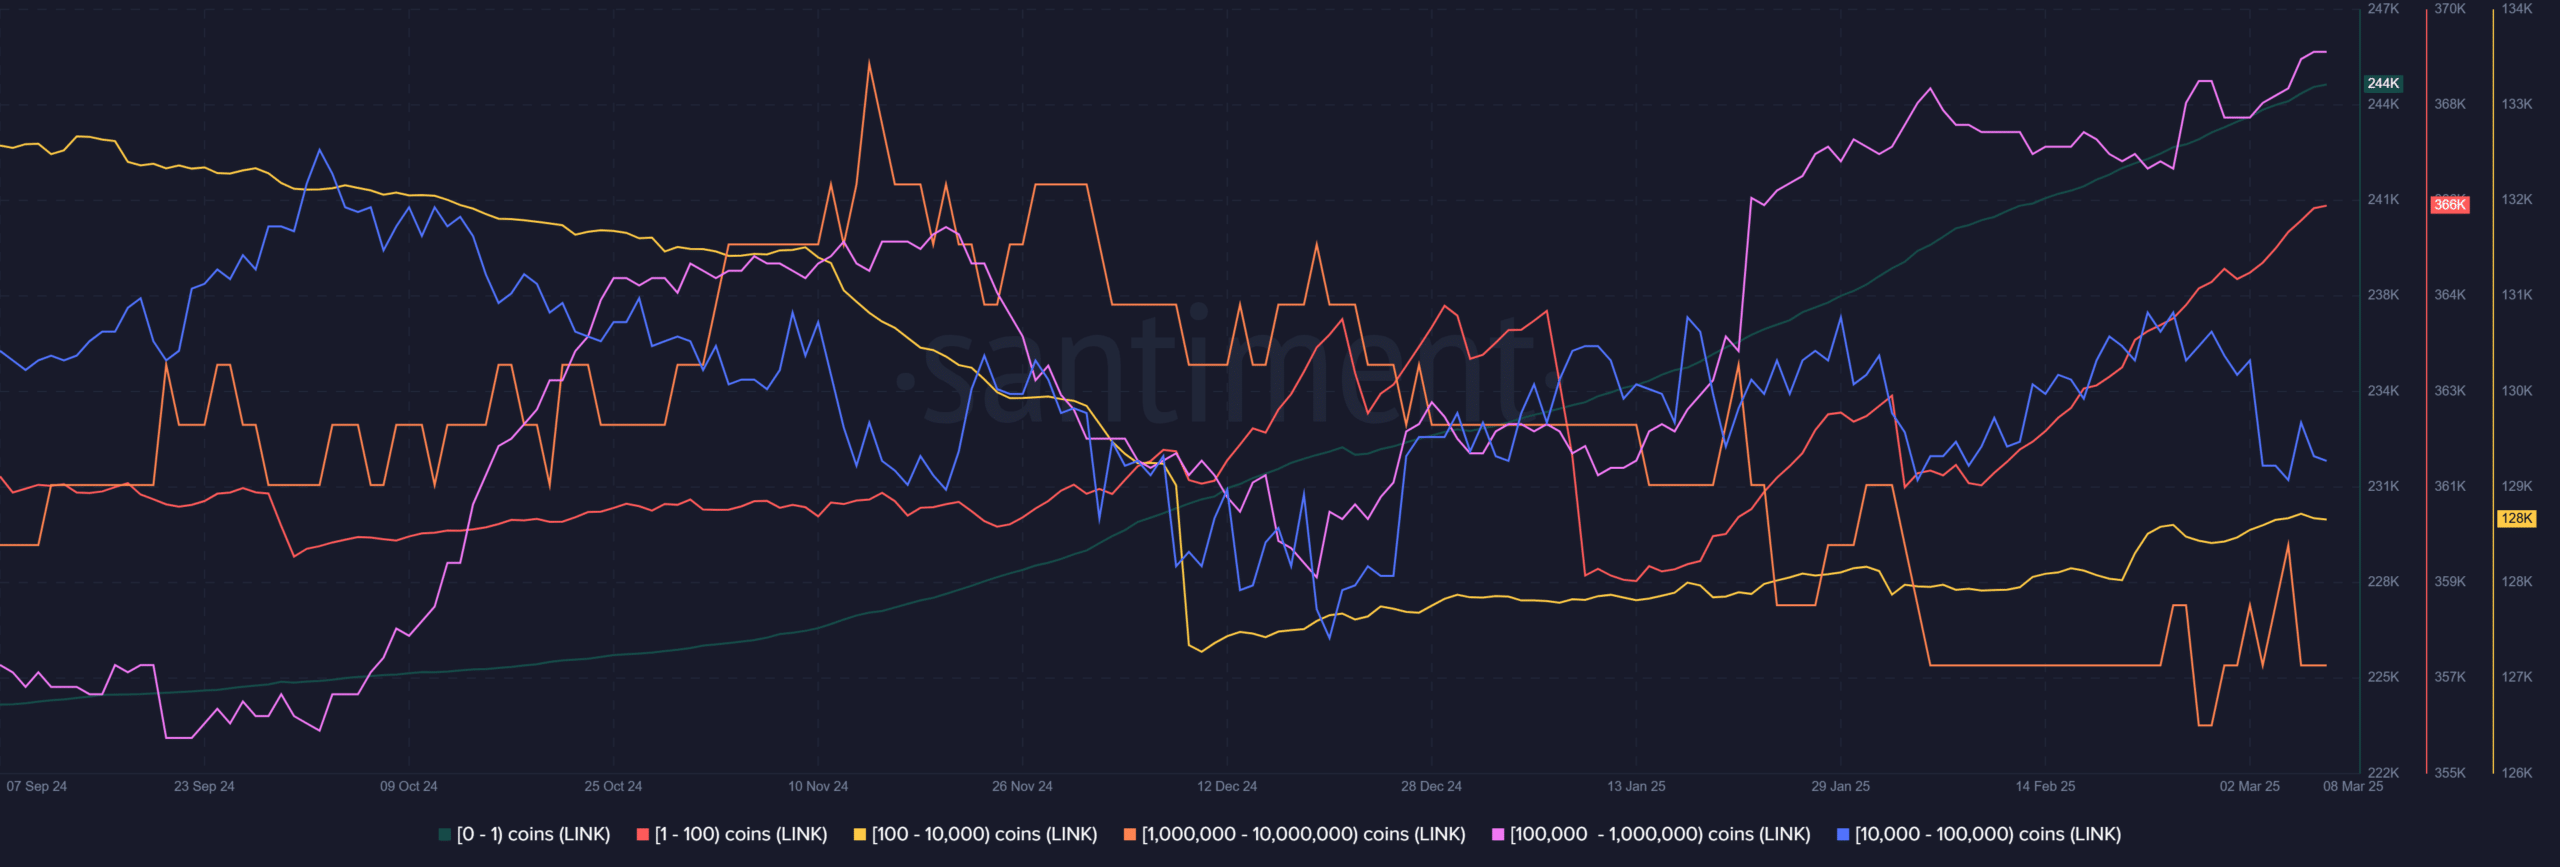
    The supply distribution chart revealed that the number of addresses with over a million LINK in their stash has been dwindling. The other holders, from retail to whale, were rising in number. The exceptions were the 10k-100k LINK holders. They have been trending south over the past two weeks, with this demographic lacking a clear trend since December.

    This seemed to back the accumulation idea that the mean coin age presented. Together, this can help Chainlink climb past the $17.45 resistance on the charts.

    Chainlink 1-day TradingViewChainlink 1-day TradingView

    Source: LINK/USDT on TradingView

    The resistance zone around $18 had served as support last month, but is now acting as resistance. The MACD showed that momentum was predominantly bearish, though it saw some green bars on the histogram due to the recent price hike.

    Finally, the A/D indicator has trended higher – Another piece of reinforcement for the idea of Chainlink accumulation during this consolidatory price action. Based on the November-December 2024 rally to $30.94, Fibonacci retracement levels were plotted. Here, the $14.54-level was the 78.6% retracement level, marking it as a significant demand zone.

    Next: Ethereum price prediction – How far can its momentum take the altcoin?

    Follow on Google News Follow on Flipboard
    Share. Facebook Twitter Pinterest LinkedIn Tumblr Email Copy Link
    Previous ArticleEl Salvador acquired over 13 BTC since March 1, despite IMF deal
    Next Article Trump turned crypto from ‘oppressed industry’ to ‘centerpiece’ of US strategy
    Avatar
    Yeek.io
    • Website

    Yeek.io is your trusted source for the latest cryptocurrency news, market updates, and blockchain insights. Stay informed with real-time updates, expert analysis, and comprehensive guides to navigate the dynamic world of crypto.

    Related Posts

    Why is crypto up today—FOMC news, ETF flows and…

    March 20, 2025

    Binance Coin (BNB) Price Prediction for March 20

    March 20, 2025

    Trump becomes first US sitting president to speak at a crypto conference

    March 20, 2025
    Leave A Reply Cancel Reply

    Advertisement
    Demo
    Latest Posts

    Here’s why Sonic erased $1.3 billion in value

    Whales lose SYRUP sweet tooth despite Maple Finance’s growth

    Ethereum Prepares For A Parabolic Move – ETH/BTC Chart Signals Strong Bullish Setup

    Ethereum Enters Strategic Pause: Will Accumulation Below Resistance Spark A Surge?

    Popular Posts
    Advertisement
    Demo
    X (Twitter) TikTok Instagram

    Categories

    • Altcoin
    • Bitcoin
    • Blockchain
    • Crypto News

    Categories

    • Defi
    • Ethereum
    • Meme Coins
    • Nfts

    Quick Links

    • Home
    • About
    • Contact
    • Privacy Policy

    Important Links

    • Crypto Chart
    • Crypto Price Chart
    © 2025 Yeek. All Copyright Reserved

    Type above and press Enter to search. Press Esc to cancel.