
The Bitcoin price crash to $91,000 was unexpected, driven by diminishing market dominance and rising volatility. Despite this setback, an analyst predicts an even bleaker outlook for the leading cryptocurrency. The formation of a bearish flag pattern suggests further price declines could be on the horizon, with the analyst projecting a steeper price plunge towards $90,000.
Bearish Flag Pattern Signal Bitcoin Price Crash
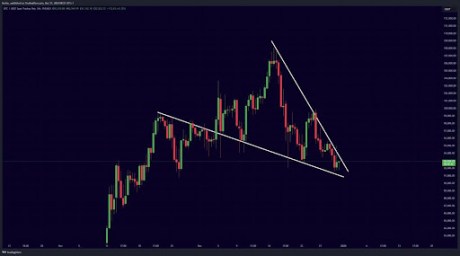
Pejman Zwin, a TradingView crypto analyst, released a chart analysis predicting a significantly bearish outlook for the Bitcoin price. The analyst based this gloomy forecast on the appearance of a bearish flag pattern and other key technical indicators.
Related Reading
According to Zwin, Bitcoin is moving within a bearish flag pattern, a technical formation that often signals a continuation of a prior downtrend. If this flag pattern holds, Bitcoin is likely preparing to break downward, which could lead to severe price declines.
The analyst indicated that the 50-day Moving Average (MA), around the $95,974 mark, acted as a key resistance or support level for Bitcoin. However, the cryptocurrency recently broke below this MA — a development considered bearish, suggesting further downside.
Zwin also disclosed that Bitcoin is moving within a heavy support zone between $95,000 and $90,870. Additionally, he highlighted that the pioneer cryptocurrency is breaking through key support lines, signaling a potential continuation of the downward trend.
Looking at Bitcoin’s price action relative to the aforementioned technical indicators and chart patterns, Zwin anticipates a significant price crash toward $91,000. The analyst highlighted that a decline to $91,000 was the minimum expected, which would occur if Bitcoin breaks current support lines.
He also disclosed that if the heavy support zone is breached, BTC could face further bearish pressure, potentially revisiting lower price levels around $90,540. Interestingly, Zwin’s bearish Bitcoin price prediction follows a recent price crash to $91,000 on Monday. During this sideways trading Bitcoin’s market sentiment has declined, with its bearish price action showing no signs of slowing down.
Although Bitcoin’s price suffered a sharp fall, it has quickly recovered and is now trading at $93,893. Nevertheless, a price drop to Zwin’s projected $90,540 target would result in a Bitcoin crash of approximately 3.6%
Alternative Bullish Scenario
While he projected a bearish outlook for the Bitcoin price, Zwin provided an alternative bullish scenario that could trigger a rebound. According to the TradingView analyst, around $95,974 could be a ceiling for Bitcoin’s price. If BTC can break above the resistance lines, it could invalidate the bearish flag pattern, signaling a potential reversal to the upside.
Related Reading
On another note, a market expert known as ‘Mister Crypto’ on X (formerly Twitter) has predicted an upcoming Bitcoin breakout to new levels. The analyst suggests that in the next two days, Bitcoin could overcome bearish trends and potentially resume its previous upward trend.