
Reason to trust
Strict editorial policy that focuses on accuracy, relevance, and impartiality
Created by industry experts and meticulously reviewed
The highest standards in reporting and publishing
Strict editorial policy that focuses on accuracy, relevance, and impartiality
Morbi pretium leo et nisl aliquam mollis. Quisque arcu lorem, ultricies quis pellentesque nec, ullamcorper eu odio.
In an X post published yesterday, seasoned crypto analyst Ali Martinez highlighted that, based on price band analysis, Bitcoin (BTC) could surge to $112,000 if it breaks and holds above a key level.
Analyst Outlines Key Bitcoin Level
Following a slight uptick after the US Federal Reserve’s (Fed) announcement to slow the pace of its balance sheet drawdown, Bitcoin is currently trading in the low $80,000 price range. However, according to Martinez, the leading cryptocurrency could reach a new all-time high (ATH), subject to certain conditions.
Related Reading
Using Market Value to Realized Value (MVRV) Extreme Deviation Pricing Bands, Martinez pointed to two crucial price levels that could determine Bitcoin’s next major move. According to the analyst, if BTC breaks and holds above $94,000, it has a ‘high probability’ of rallying to $112,000.
On the flip side, if BTC falls below $76,000, it risks plunging to $58,000 – or even $44,000 – if market conditions turn bearish. Notably, BTC previously hit $76,606 on March 10 before rebounding to its current range in the low $80,000s.
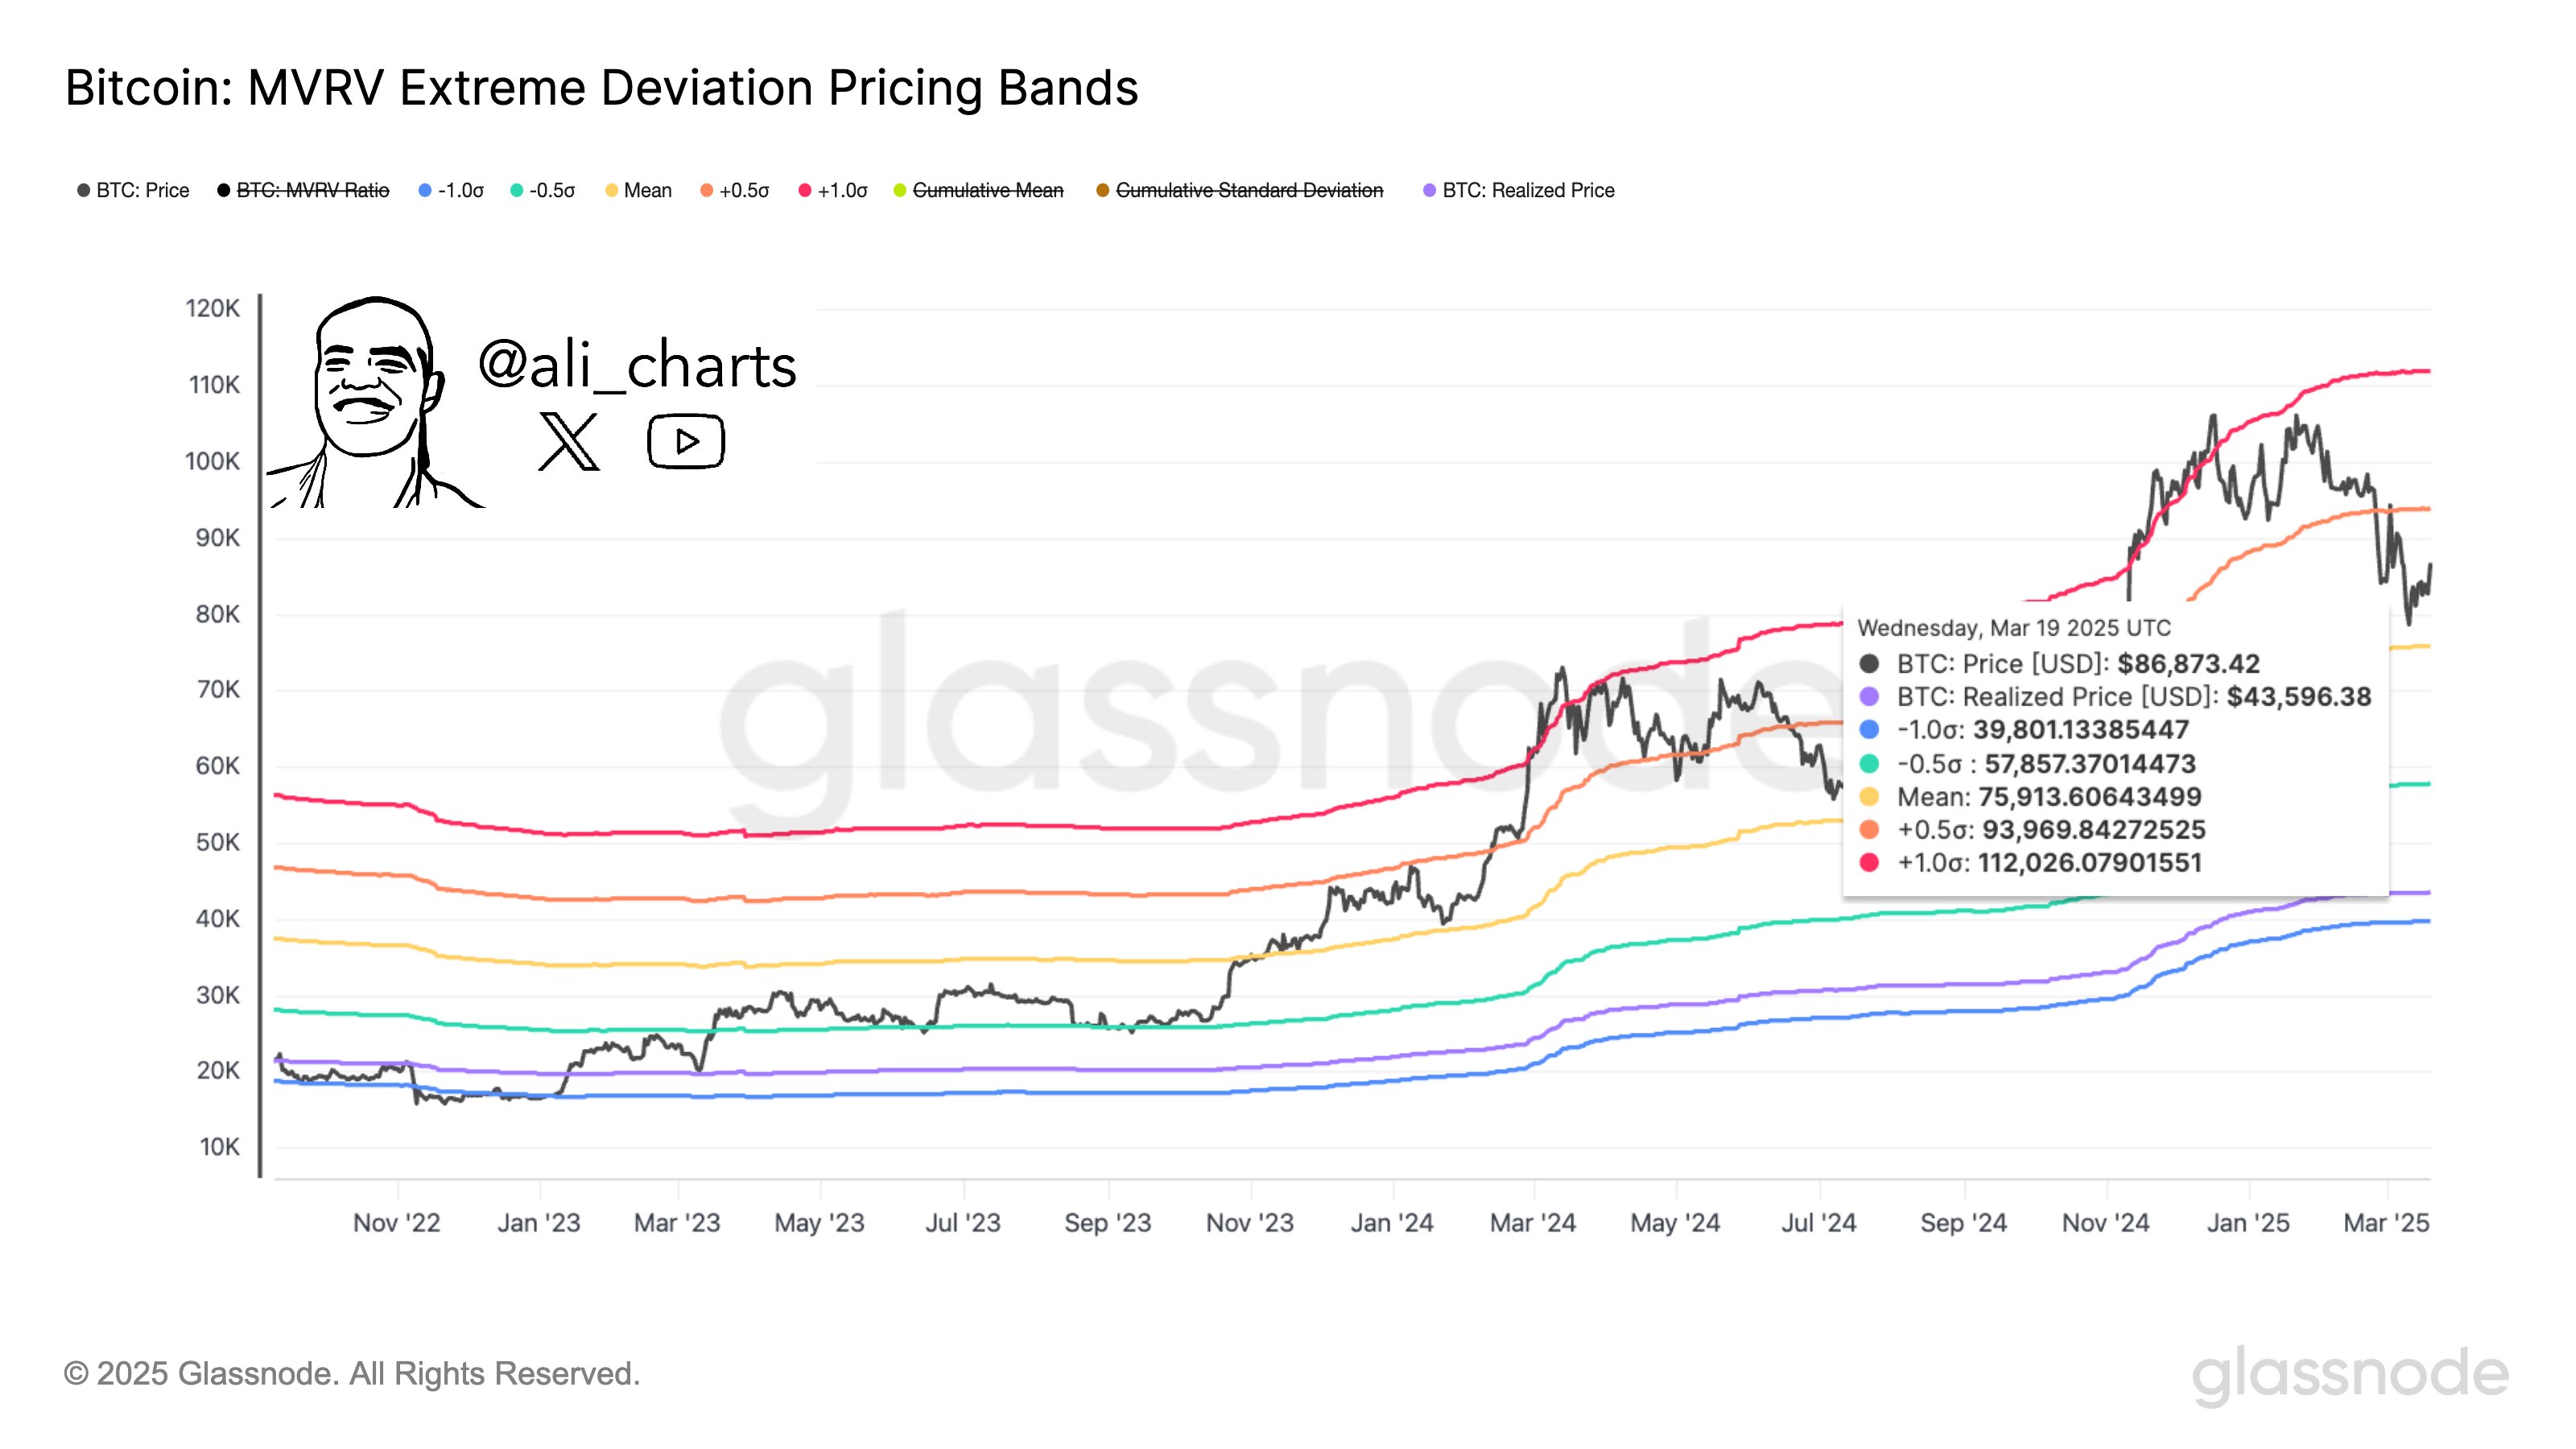
For the uninitiated, MVRV Extreme Deviation Pricing Bands show whether an asset, like Bitcoin, is priced too high or too low compared to its past averages. It helps spot when the market might be overbought – potential market top – or oversold – potential buying opportunity.
According to Martinez’s chart, BTC is currently trading between the mean – yellow band – and +0.5 standard deviation – orange band. A sustained breakout above or below these bands could indicate Bitcoin’s next significant price direction.
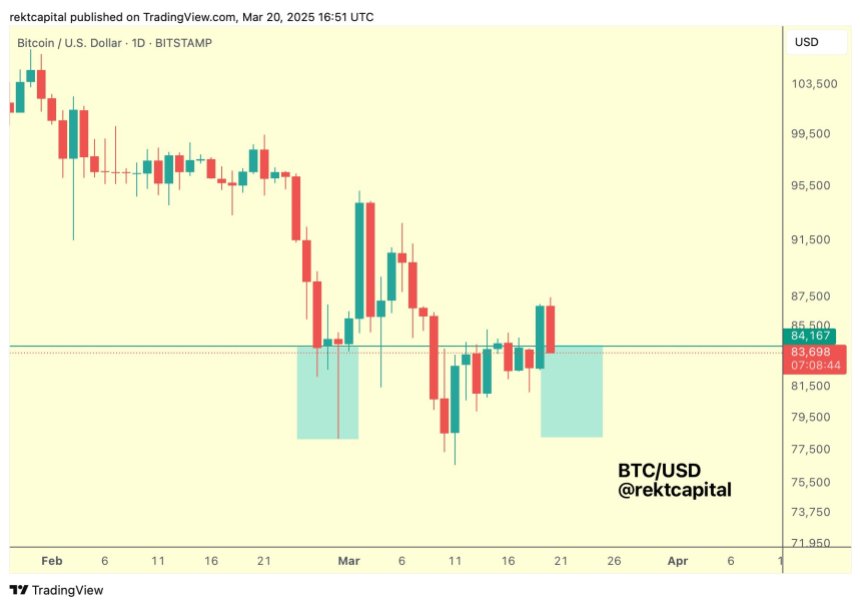
Fellow crypto analyst Rekt Capital noted that Bitcoin is re-testing the crucial $84,000 support level. A successful hold at this price could set BTC up to challenge the $94,000 resistance, potentially paving the way for a new ATH. The analyst stated:
BTC has produced long wicks below this level before which is why a Daily Close above $84k is essential for this retest to be successful.
Will BTC Witness A Short Squeeze?
In a separate X post, crypto trader Merlijn The Trader suggested that widespread pessimism around BTC’s recent price action might fuel a powerful short squeeze. According to the analyst, roughly $2 billion worth of short positions could be liquidated if BTC reaches $87,000 – potentially driving the price even higher.
Related Reading
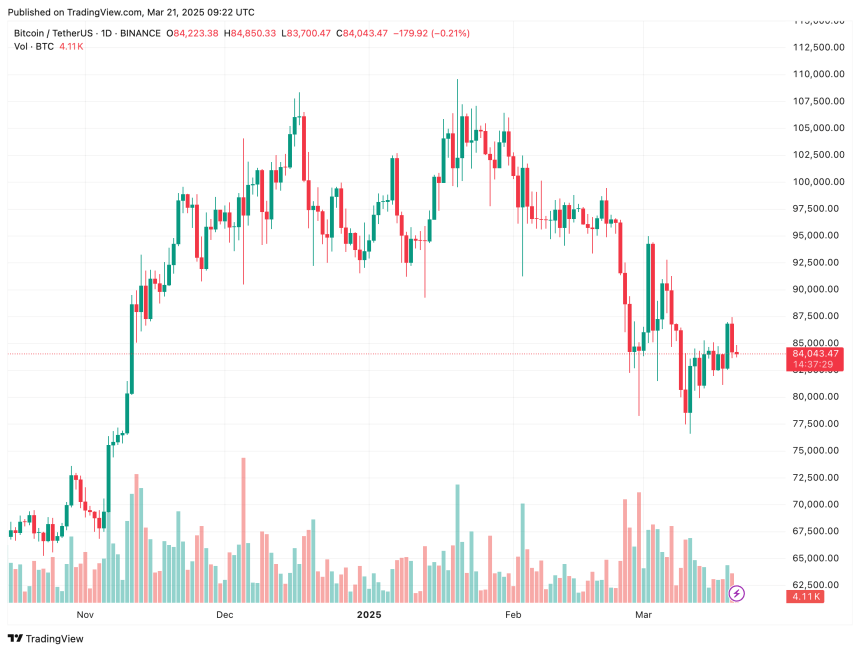
Adding to the bullish outlook, crypto entrepreneur Arthur Hayes suggested that BTC’s March 10 drop to $77,000 may have marked the bottom of this market cycle. At the time of writing, BTC is trading at $84,043, down 2% in the past 24 hours.
Featured image from Unsplash, Charts from X and TradingView.com