Bitcoin has experienced significant price movements in the past few days, largely influenced by macroeconomic developments and market fundamentals.
Following the Federal Open Market Committee (FOMC) meeting and a speech by Federal Reserve Chair Jerome Powell, Bitcoin’s price dropped sharply below $99,000.
However, the leading crypto quickly rebounded, climbing back to $104,000 earlier today before settling at $100,573 at the time of writing. This represents a 3.4% decrease over the past day and a roughly $67 billion reduction in its market cap valuation.
Related Reading
Exchange Transactions Hit Record Lows
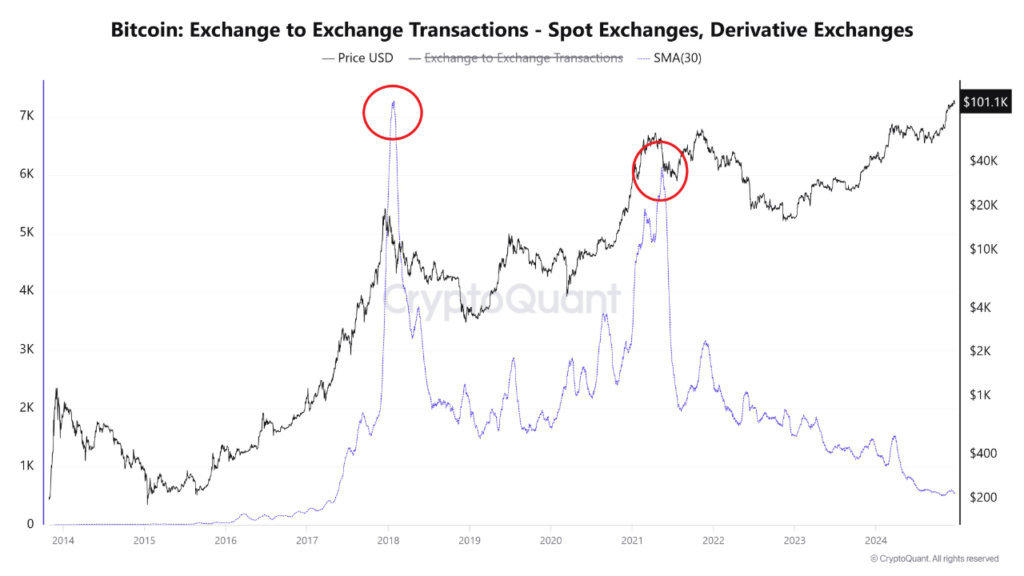
Amid this price performance, CryptoQuant analyst known as Woominkyu provided insights into Bitcoin’s market activity, highlighting declining exchange transaction volumes.
According to Woominkyu, historical data suggests a correlation between transaction volume spikes and significant price movements. For example, peaks in exchange transactions coincided with Bitcoin’s dramatic price surges in 2017 and 2021.
However, recent data shows a marked decline in transaction volumes on both spot and derivative exchanges, reflecting reduced trading activity compared to previous years.
This decrease, according to the CryptoQuant analyst may indicate “waning market participation,” suggesting a “period of consolidation or reduced volatility” in the near term.
Bitcoin Key Support Levels and Technical Insights
Market intelligence platform IntoTheBlock has shed light on an important support zone forming just below the $100,000 mark. The data shared by the platform reveals that over 1.45 million BTC were accumulated at an average price of $97,500.

This accumulation has established a significant demand zone, potentially serving as a “buffer” against further price declines. The importance of this level lies in its ability to provide a foundation for price stability, particularly as Bitcoin navigates its current phase of market correction.
It is suggested that a breach below this zone could trigger further downward pressure, while holding above it might boost recovery efforts.
Meanwhile, from a technical perspective, insights shared by market analyst Satoshi Wolf highlight the critical nature of Bitcoin’s current price levels. The cryptocurrency recently tested the $100,000 support, aligning with the 100-day Exponential Moving Average (EMA).
Related Reading
This level is pivotal as it combines technical indicators with psychological significance. The Moving Average Convergence Divergence (MACD) indicator shows bearish momentum, while the Relative Strength Index (RSI) nears oversold territory, signalling the potential for a price reversal.
Wolf suggests that traders monitor for a confirmed breakout above $104,000 or a breakdown below $100,000, with volume confirmation being key to validating either.
📊 $BTC Analysis: The chart shows a recent pullback after a strong uptrend, suggesting potential profit-taking. Price is testing the 100,000 support, aligning with the 100 EMA, a crucial level to watch.
If it holds, a bounce back towards 104,000 resistance is possible. MACD… pic.twitter.com/smLaqsr2Tz
— Satoshi Wolf (@SatoshiWolf) December 18, 2024
Featured image created with DALL-E, Chart from TradingView

