
The on-chain analytics firm Glassnode has revealed the level Bitcoin would have to rise to if it has to reach the historical top zone in this pricing model.
Bitcoin Hasn’t Surpassed Last MVRV Pricing Band Yet
In a new post on X, Glassnode has talked about the extreme euphoria threshold of the Bitcoin Market Value to Realized Value (MVRV) Pricing Bands. The MVRV Pricing Bands is a pricing model for the cryptocurrency that’s based on the MVRV Ratio.
Related Reading
The “MVRV Ratio” is a popular on-chain indicator that keeps track of how the value held by the Bitcoin investors (that is, the market cap) compares against the value that they initially put in (the realized cap). When the metric is greater than 1, the investors are holding more value than their initial investment, meaning that they are in a state of net profit. On the other hand, it being under the threshold suggests the market as a whole is underwater.
Historically, the holders being in too much profit has often signaled overheated conditions for Bitcoin, due to the fact that mass selloffs with the motive of profit-taking become probable in such conditions. Similarly, the dominance of loss has led to bottoms, as there aren’t many sellers left during these periods.
The MVRV Pricing Bands aim to capture this relationship. It defines certain price levels for the cryptocurrency that correspond to important levels in the MVRV Ratio.
Here is the chart for the model shared by Glassnode that shows the trend in these Bitcoin pricing bands over the last several years:
From the graph, it’s visible that the 0.8 pricing band, which is where the MVRV Ratio assumes a value equal to 0.8, has been around where bear market bottoms have formed for the asset. Right now, BTC is far above this level, situated at $33,100. The coin’s price is also at a significant distance from the 1.0 level of $41,300, which corresponds to the cost basis of the average address or investor on the network.
The pricing bands that BTC is currently trading under are the 2.4 and 3.2 levels, located at $99,300 and $132,400, respectively. The former of these has historically served as a signal that the bull market is getting heated.
Related Reading
BTC can stay inside this zone for a while, but once the market cap surpasses the 3.2 level, it becomes very likely that some type of top is going to be hit soon.
The chart below illustrates just how rare it is for the asset to trade in the region above 3.2:
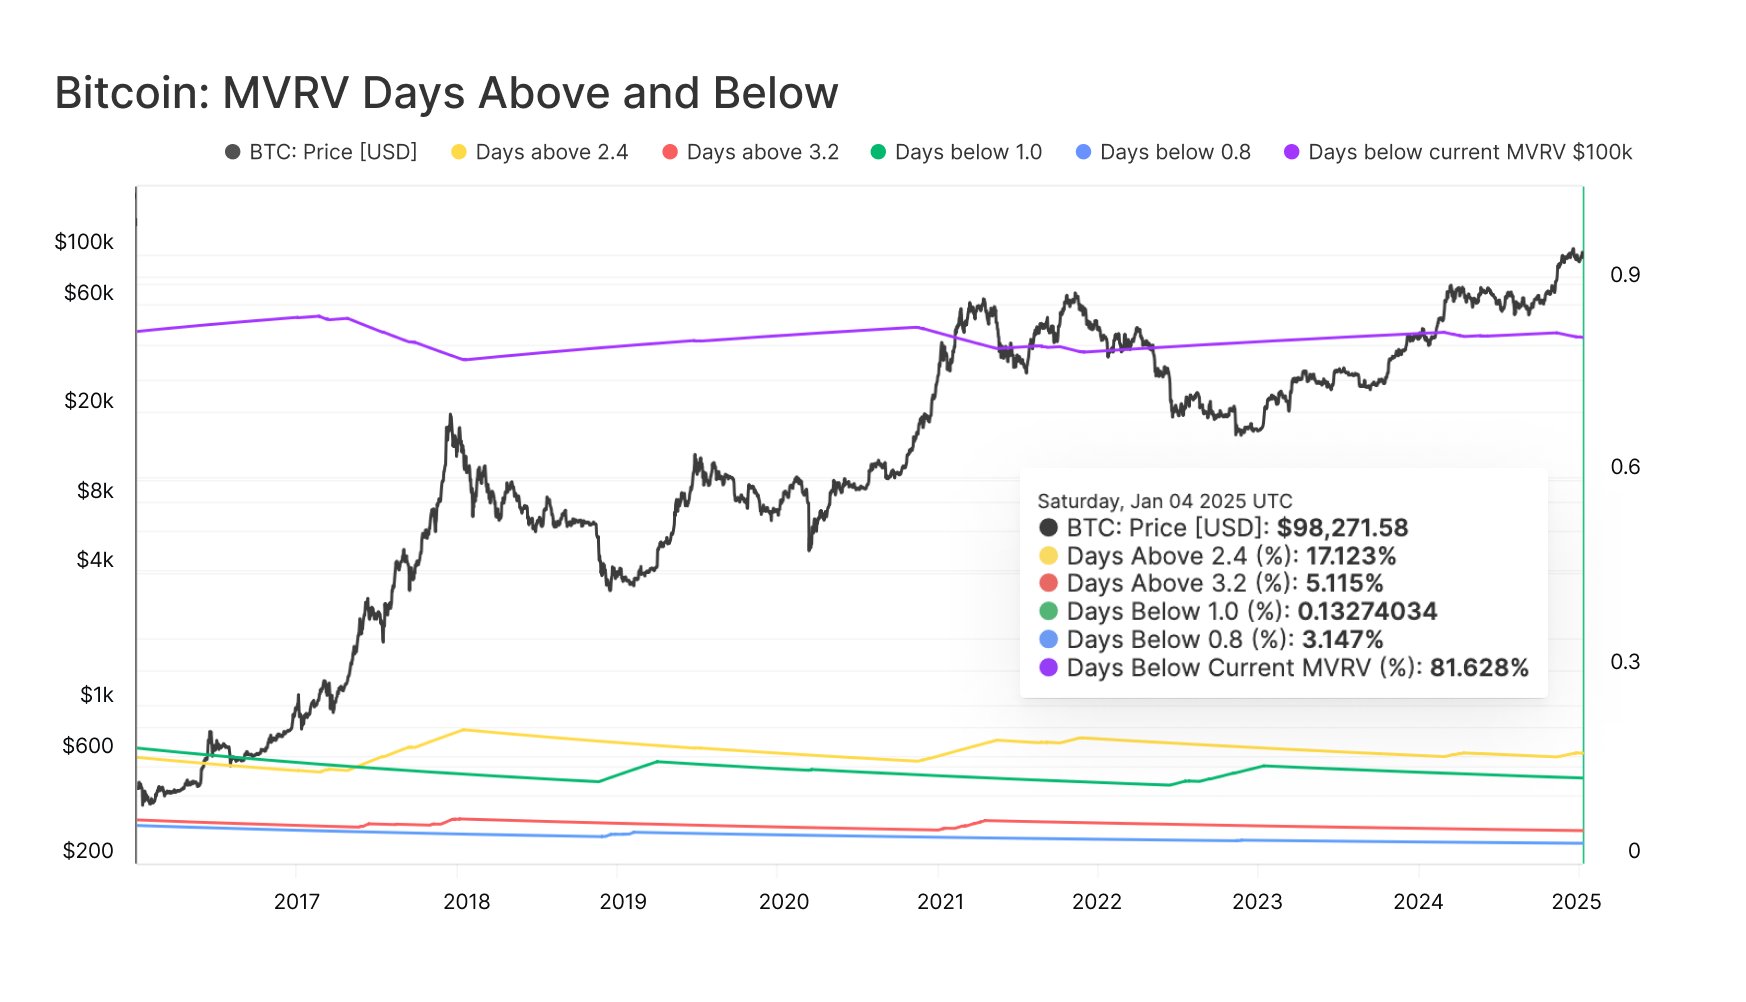
“BTC price has historically spent only ~5% of trading days above the 3.2 MVRV level,” notes the analytics firm. “This highlights how rare such peaks are and reinforces why it’s often considered an “extreme euphoria” zone.”
So far, Bitcoin hasn’t been able to surpass this line in the current cycle. If the past bull markets are anything to go by, the top would only occur above this level, which would imply more room still left for the asset to run in the current cycle. It only remains to be seen, though, whether the pattern would actually hold this time or not.
BTC Price
At the time of writing, Bitcoin is trading at around $93,400, down more than 3% over the last seven days.
Featured image from Dall-E, Glassnode.com, chart from TradingView.com