
Bitcoin’s price has recently experienced notable volatility, driven by significant market developments and investor activity. Following an initial decline in recent days, BTC surged above $94,000 on Sunday.
This increase was fueled by reports of an upcoming US strategic crypto reserve that includes BTC and other major digital assets. However, as of today, BTC is trading just below $93,000, signaling an unstable upward momentum in the crypto market.
Amid this price movement, a recent analysis by CryptoQuant analyst KriptoBaykusV2 highlights an evolving pattern in Bitcoin’s net exchange flow, offering insight into investor sentiment. This data suggests that exchange inflows and outflows may play a crucial role in shaping Bitcoin’s short-term price direction.
Bitcoin Exchange Flows and Investor Sentiment
According to KriptoBaykusV2, on February 25, Bitcoin saw a significant inflow to exchanges, with approximately 8,400 BTC being deposited. Historically, large inflows suggest increased selling pressure, as traders move assets to exchanges in preparation for liquidation.
This was followed by a decline in Bitcoin’s price, aligning with previous market trends where increased supply on exchanges often leads to downward price movements.
The following day, February 26, Bitcoin experienced a shift, with a substantial amount of BTC being withdrawn from exchanges. Large-scale outflows typically indicate a preference for holding, reducing the available supply on exchanges and potentially supporting price stability.
This shift coincided with Bitcoin’s price finding support and beginning to recover, reflecting investor confidence in the asset’s long-term prospects. The analyst noted:
In summary, those closely monitoring Bitcoin’s exchange movements should take note: Large inflows into exchanges may indicate heightened selling pressure, requiring caution. On the other hand, significant outflows suggest that investors are opting to hold, which could lead to price appreciation. We will see in the coming days how these trends continue.
Short-Term Selling and Market Trends
Meanwhile, a separate analysis by another CryptoQuant analyst, abramchart, suggests that Bitcoin holders have started selling at a loss. The Spent Output Profit Ratio (SOPR) index, which measures the profitability of short-term investors, according to the analyst recently recorded a value of 0.95.
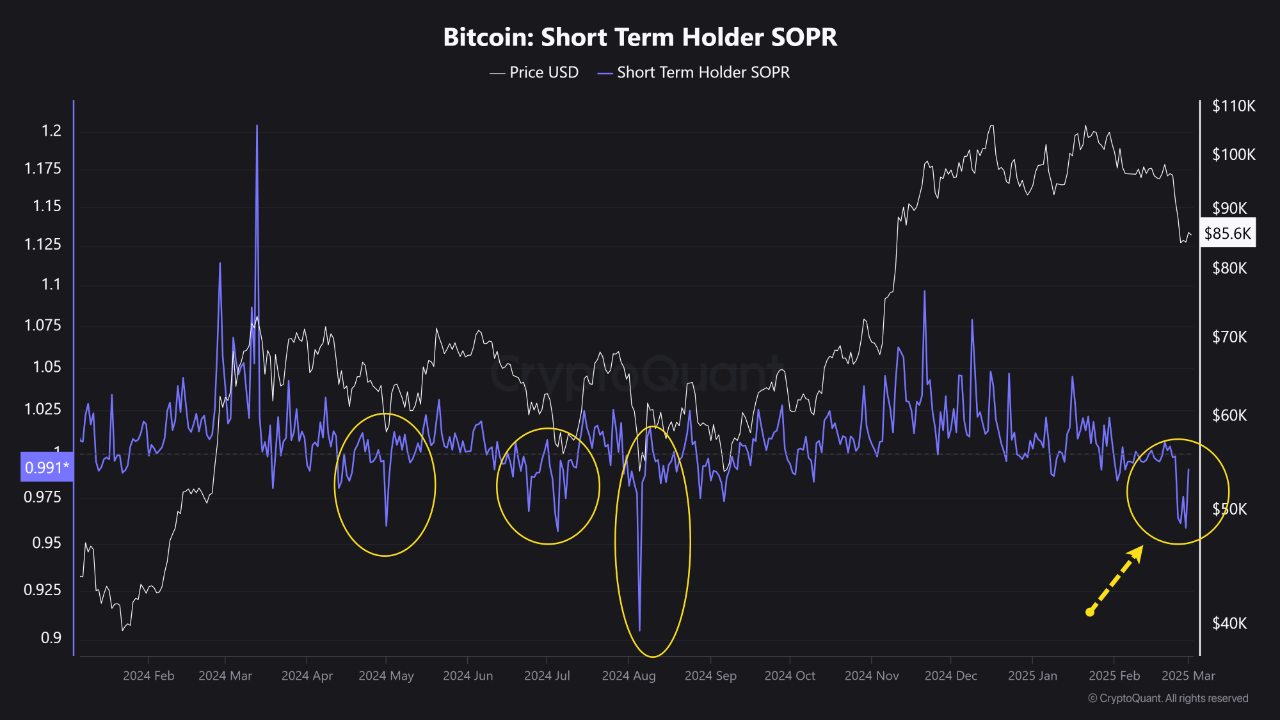
This level, the lowest since August 2024, suggests that more traders are selling BTC at a loss, an indication of capitulation. Historically, such periods have been followed by market recoveries as selling pressure eases and accumulation phases begin. The CryptoQuant analyst wrote:
The SOPR measures the proportion of Bitcoin wallets that have held Bitcoin for more than 1 hour and less than 155 days. Values over ‘1’ indicate more short-term investors are selling at a profit. Values below ‘1’ indicate more short-term investors are selling at a loss., which is a sign of capitulation and a return to an upward trend.
Featured image created with DALL-E, Chart from TradingView